This article is a deep dive for marketing specialists. It gives tools to understand the current status of a brand or product, and what kind of implications such position has to strategic consideration and operational expectations.
MARKET DYNAMICS MAPPING
I created the Market Dynamics Mapping tool to help define insights and required activities into brand positioning and offering game plan. Each quarter in this map represents a very different business environment and tool kit for survival and growth.
Each company and offering will have a position on this map from the buyer’s and market’s perspective, regardless of their situation and revenue volume. This map can be used as market view by brand or offering range to analyze competitive situation.
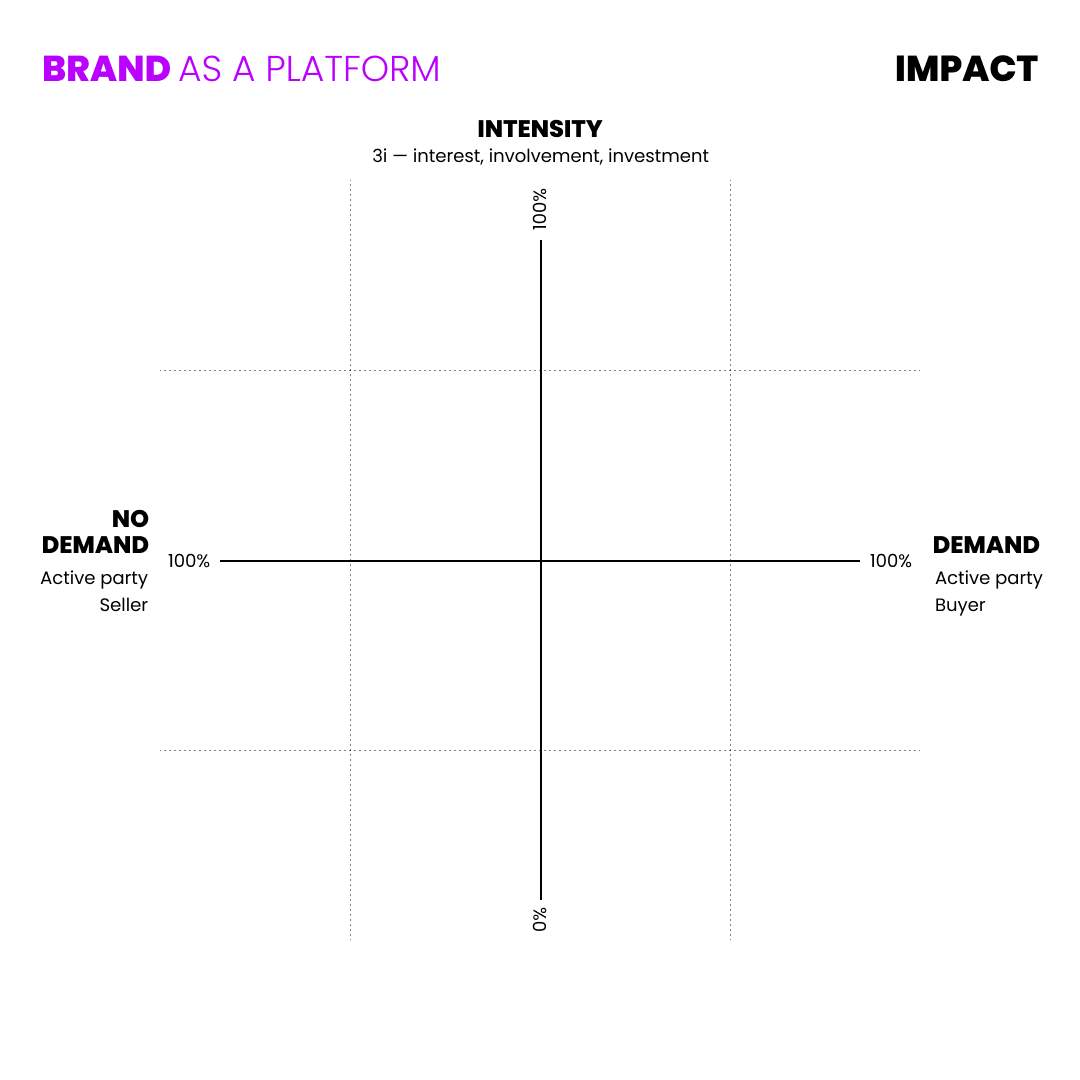
Figure 28: The market dynamics map. Brand and category behavior logic
The vertical intensity factor relates to the customer’s level of participation in the business decision. On the graph, the horizontal line represents demand, awareness and preferences of the customer for the vendor’s offerings. Brands are heuristics[1]: the brand dictates the way offerings are perceived, and in turn, that effects the customer’s acceptance. In an optimal case, a brand and offering gets mapped to the right side of this model where the buyer is the active party in inducing the sales and the profit margin on the offerings is high. In such a case, you have low customer acquisition and retention costs and better profit margins.
On the path to decision-making in defining desirable purchases, intensity is important. When decisions are made with little consideration or if the decisions are habitual, it is only possible to influence decisions in advance of the customer’s point of decision.
Companies in low-intensity sectors (below 50%) are influenced by autonomous systems and unconscious decision-making. The choices are not considered to be that important and related investment in offerings may be nominal.
Due to narrow windows of opportunity to influence customer decisions, the two lower sectors are brand and impulse-driven markets, in which brand awareness and perception nudges[2] and choice architecture[3] can work wonders in guiding the customer.
Even if the buying decision takes a few minutes and customers choose to do some research online, making the most of opportunities to influence the customer with performance marketing, SEO, and content can create an atmosphere where they have essentially already committed. This model is fleshed out below.
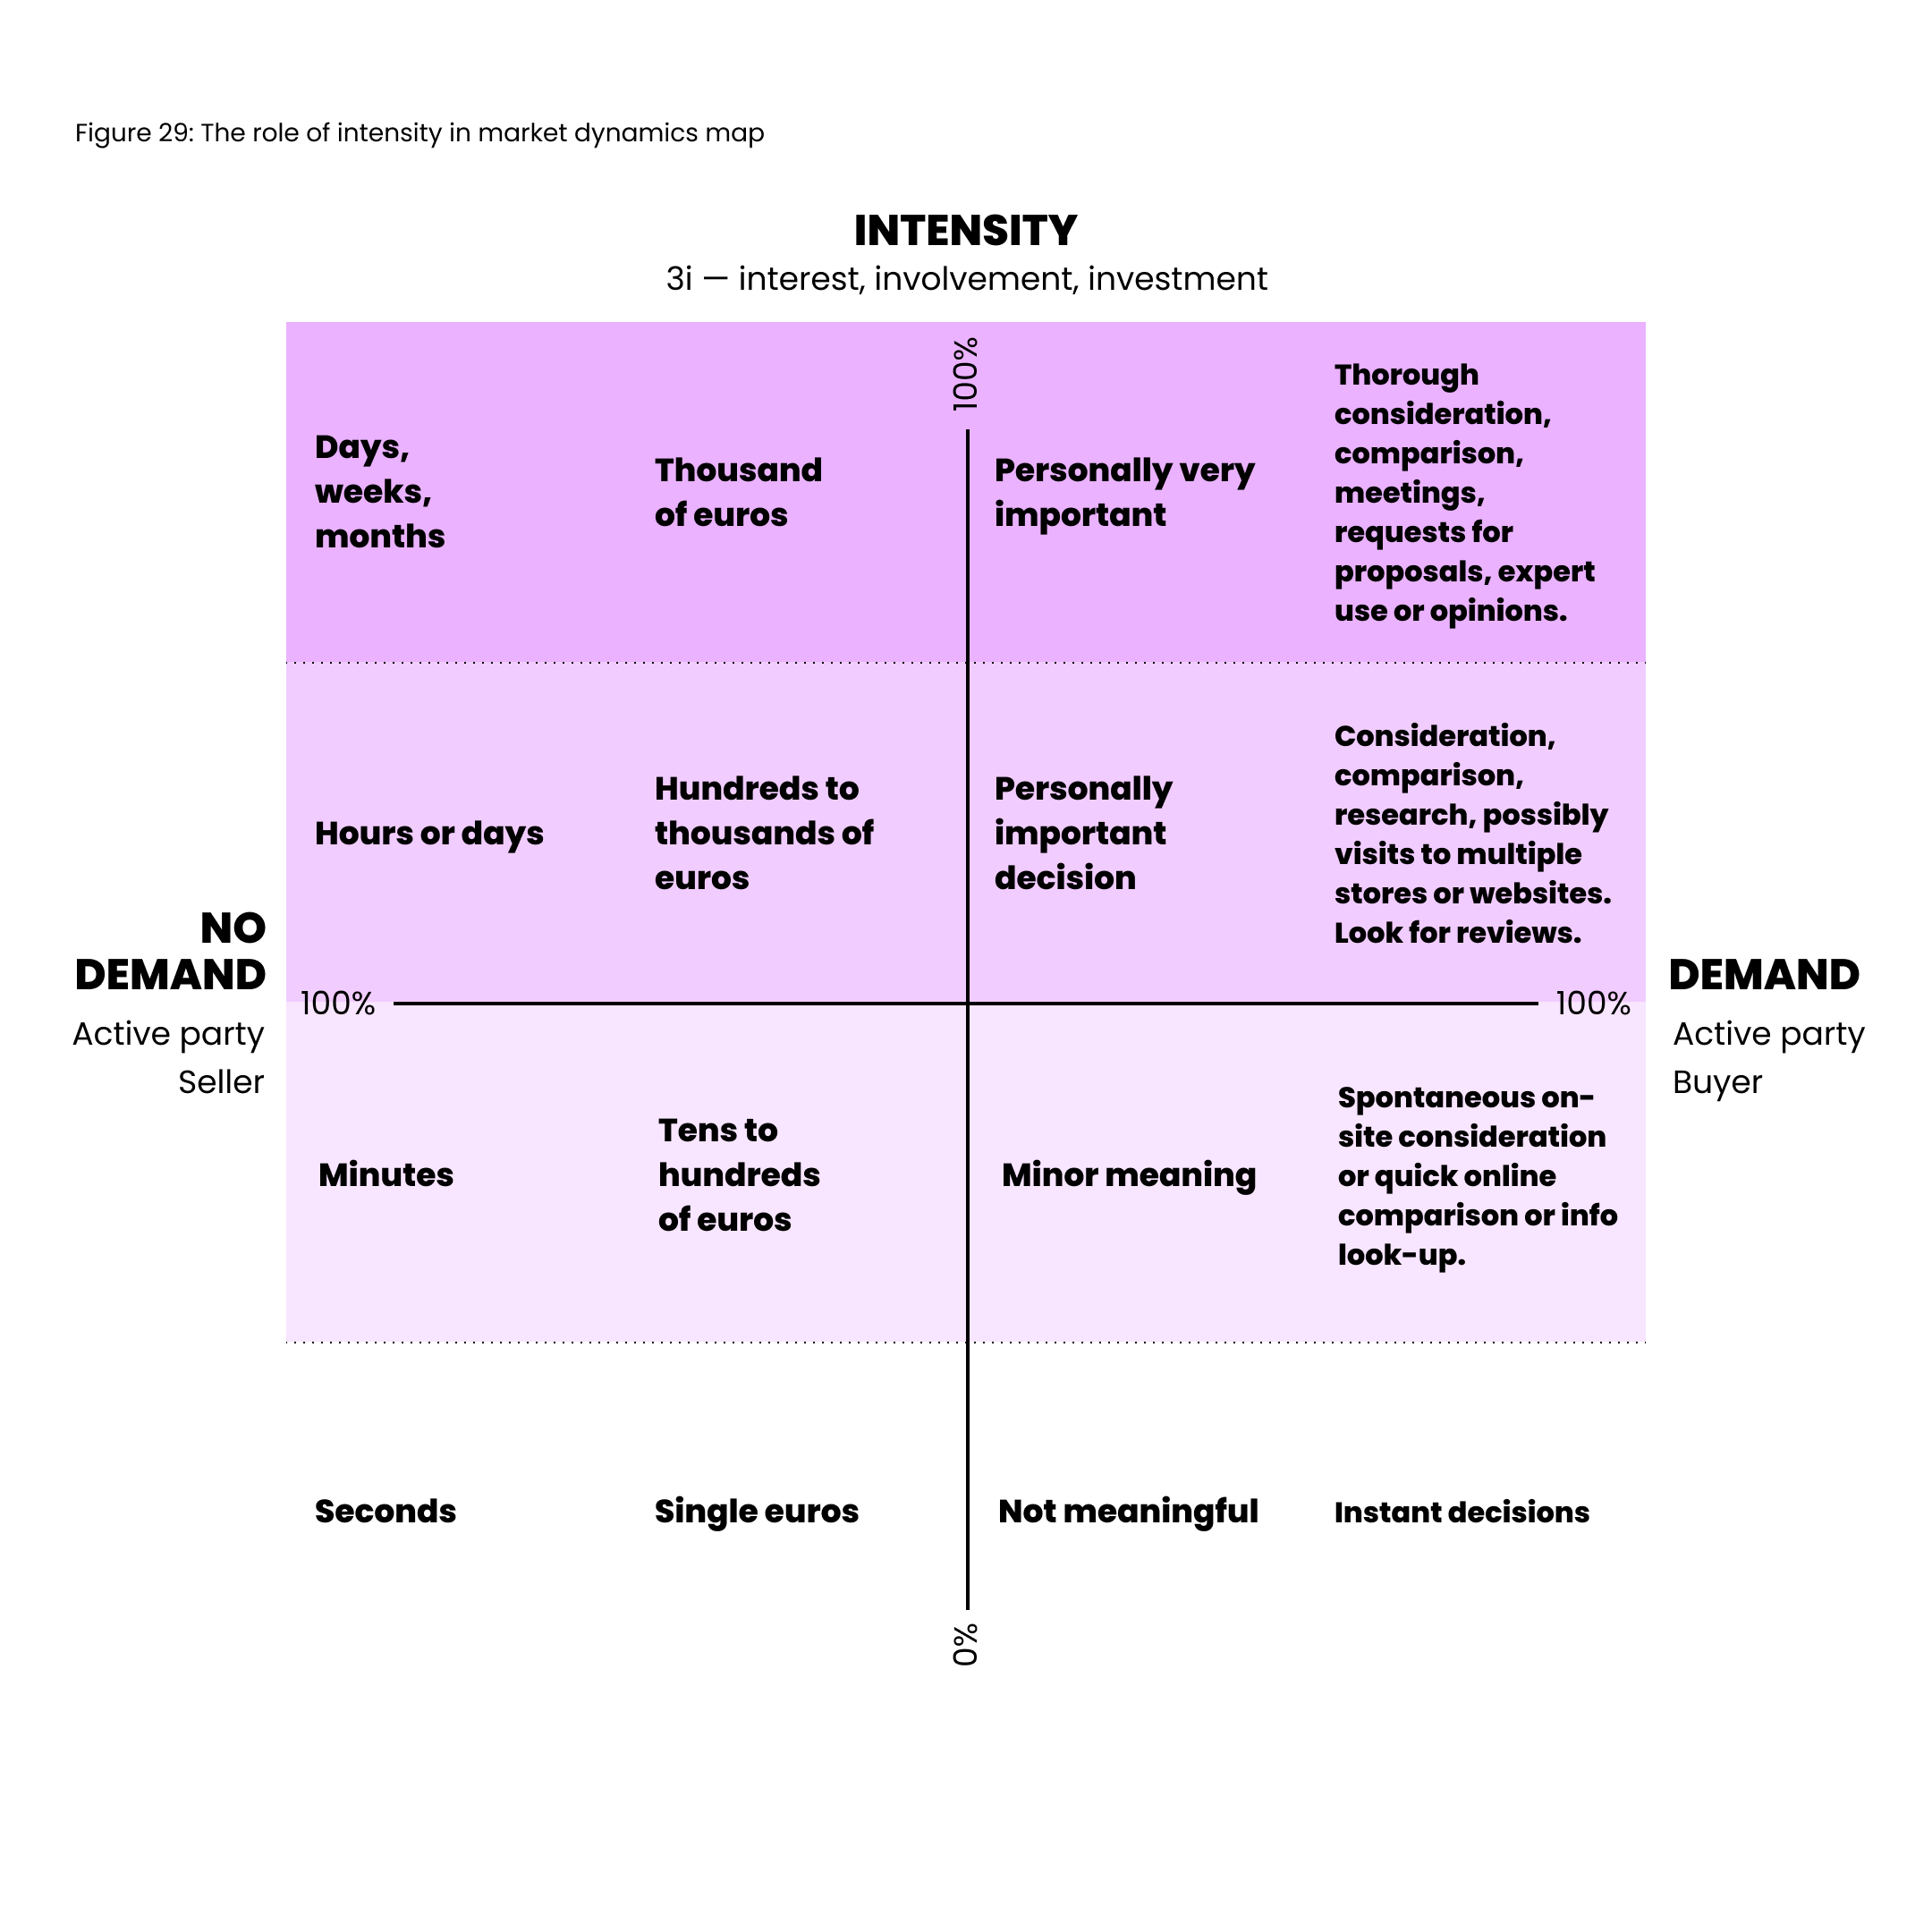
Looking at the lengthier consideration times that fall between hours and months, conscious decision-making is the dominant approach and a familiar one in B2B markets. These are the markets where you can expect to get RFIs and RFPs from customers to request information or a proposal.
In these categories, customers are willing to spend more time, probably invest more money, and consider the decisions they make to be more important for them personally or professionally. They are also a domain where customers are more likely to use external consultants to help with partner or solution selection to make better choices
When customers engage in learning and studying solutions and offerings, this is where you can optimize your sales team’s time allocation with signals about customer’s interest.
The Role of Brand Awareness and preference
Branding efforts give you tools to define how a brand positions in terms of demand, market share, and competition. Share of search is a marketing metric that provides insight into the effectiveness of branding and brand recognition. The higher your share of search is compared to competition, the stronger branded demand you have. The next figure shows an example of how to look at a demand matrix that reflects on how brand affects customer/vendor relationships:

Figure 30: The role of demand
The more effective the brand’s positioning by awareness and preference (defined by the right on the chart), the more profitable the brand is likely to be. In behavioral economics, this position defines top-of-mind availability and how likely it is to solidify a long term relationship with the customers. This quadrant also represents a status quo: brands are trusted and exhibit expected behaviors rather than unpredictability.
The brands and products on the left (the white quadrant) are lesser known, or the brand or category of the products may be immature. The brand must capture the customer’s attention and has the burden of proof to convince customers that it is the best choice in servicing the customer.
The vendor’s best chance to gain the customer’s consideration is to make a greater effort to prove its case. It requires a lot more resources, the ROMI (Return on Marketing Investments) is naturally lower, and there is very little to no natural demand. This is another reason why the long term impact of brand marketing efforts is important. Performance marketing works in one-to-one propositions, but building other relationships adds a possibility to bring customers to you.
In behavioral economics, it may be more useful to add dimension to the matrices. By mapping biases against patterns, the dynamics of each combine into a potentially more useful view to influence the company’s success.

The right side of the matrix represents the mapping of strong brand positioning in the market. It can be considered the status quo. These brands are known, trusted and they provide customers with the starting point for their decision-making because they embody the established perception and reputation.
Socially, the herd mentality will lead decisions in the direction of these companies and other people’s trust reduces the experienced probability of risk. It creates a sense of safety in decision-making, even if illusory. These companies have probably earned that reputation in decades rather than years.
This view to the market logic can also be emphasized with the law of double jeopardy, which has been extensively explained in Jenni Romaniuk’s and Byron Sharp’s book “How Brands Grow – Part 2”. The first jeopardy states, that smaller share brands have fewer sales because they have fewer customers. The second jeopardy states, that those customers are slightly less loyal. These laws have been extensively and empirically proved over a very long time and they match perfectly with the market dynamics map and behavioral economics logic in Figure 31. For companies to gain sustainable profitability and more loyal customers it is imperative to move from left to right on this map.
brand building = demand generation = improved loyalty = higher profits = lower risks.
This is another reason to abandon current value based segmentation model and move to current & potential value matrix. You can never stop selling and acquiring new customers or stop strengthening your brand. If your brand starts to deteriorate, you will also suffer from lower loyalty and face growing risks and erosion in sales, customers and profits.
If we look at a mapping that overlays portfolio management and solution development in a matrix, it is easy to visualize how different positions your offerings have on this map 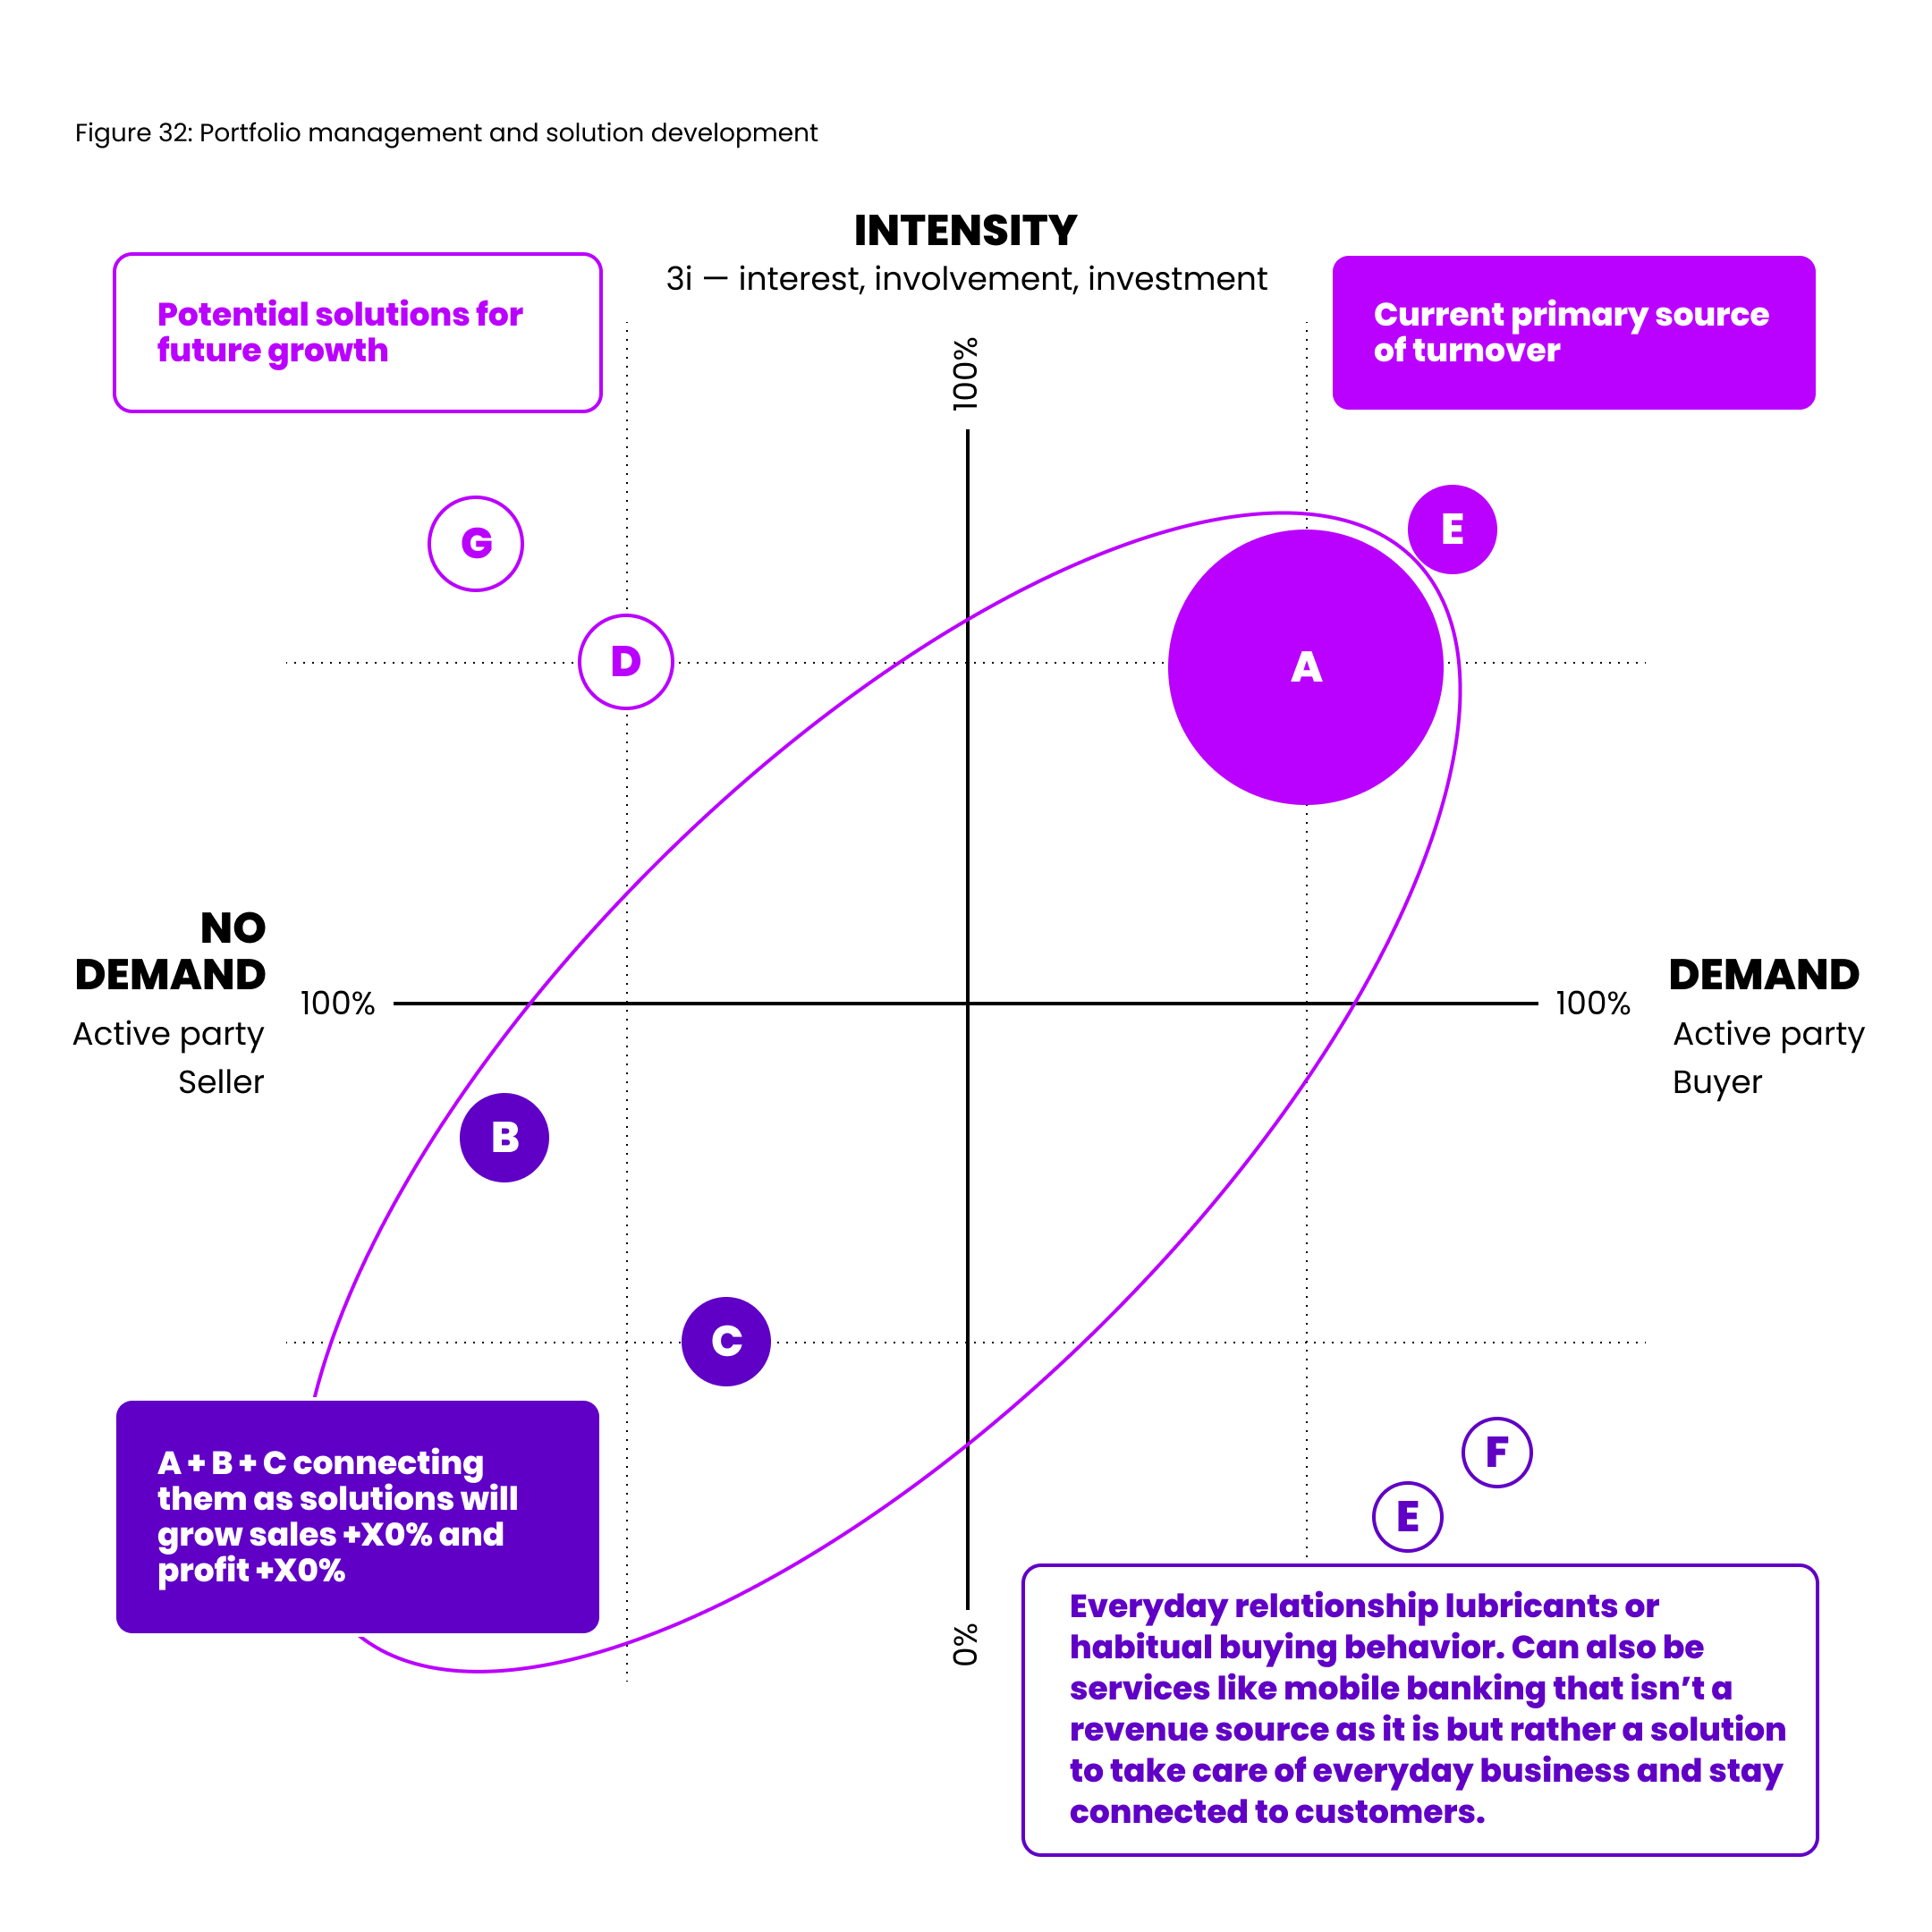
By connecting B and C offering as a solution with offering A, we are leveraging the offering A’s strong position to improve offering penetration, ARPA, and profit. This can only be done if A, B and C serve the same use case and can be presented as a solution with stronger value proposition than just offering A. Offerings B and C have little demand as solo offerings, but they have low intensity buying consideration, which makes them a perfect bundle.
Offering E has a strong position, but the market is probably smaller than in offering A. That’s why the turnover is smaller. Offerings G and D could also be bundled with offering A or E if they serve the same use case. They represent a much higher intensity than B and C, which suggests that these offerings are more expensive and because they have little demand they are probably new or emerging solutions.
If they don’t have direct synergies with offering A or E and if they have competitors that position more to the right side of the map, they are underdogs requiring awareness and unique competitive edge to grow and move to the right on the map.
Power in the market dynamics map that contains competitor information will help compare opportunities and refine a growth path. It is good to list relationship driver offerings, potential up-sales offerings, islands, entry offerings, and accelerator offerings as they represent different position in customer relationships/
- Relationship driver offerings: The most well-known and adapted offerings that represent majority of market penetration and turnover
- Potential upsales offerings: Offerings that don’t have immediate demand, but play well once combined with relationship driver offerings or entry offerings
- Islands: Offerings that have little synergy with other offerings. These are islands upon themselves. The offerings need consideration as to whether they will be developed in the longer term to increase their demand and connectivity to other parts of the portfolio, or whether they should be divested.
- Entry offerings: Offerings that attract channel sales and form customer relationships. These can be expanded with or included in other offerings
- Accelerator offerings: These offerings don’t necessarily deliver a lot of turnover, but they accelerate customer’s offering adaptation and desire for other case study models and collaboration (eg. Offerings E and F in figure 32 could be such). Their primary value is in a halo effect.
When you add offerings to the map, you can expand the relevance of comparisons with additional information about competitive status, channels, market success, and strategic importance. Turning existing products into broader solutions and case studies can generate new value for the existing capabilities that customers are already familiar with.
This works to diminish sales costs and risks. Meshing the capabilities of existing products and aggregate resources can also build solutions that are hard for competitors to replicate.
Combining new offerings with a strong portfolio can revitalize relationships with customers and spur enhanced sales. Insights about solving customer’s challenges makes it simple for companies to improve their own growth rates by improving their business modeling remotely. They can depend on the vendor for having insight into need and affecting diversity.
Connection to 180ops data-driven management
180ops makes it easy to analyze what to sell, to whom, when and why. Market Dynamics mapping can be used for workshopping and deepening the insights that are available with the 180ops tools. One single tool or technology can not solve all challenges, but they give you a starting point for further discovery.
This approach to creating a competitive understanding of the market and approaching offering bundling has worked very well and provided valuable insights and decision to take further. In case you are interested in having a workshop like this, our partners can help you arrange one. To see what the 180ops tool could do for your organisation, book a free demo with our team.
[1] Mental triggers that can simplify problem solving using practical methods to reach immediate, short-term goals.
[2] The embodiment of adaptive designs in the decision-making environment to influence the behavior of groups or individuals.
[3] Models used to make presentations to clients to help speed things along.