
Strategic thinking expert Richard Rumelt, in his book The Crux: How Leaders Become Strategists, emphasizes that the toughest part of strategy is identifying the right opportunities—diagnosing where real growth lies and understanding the critical phenomena that drive success or failure.
A Commercial Management Operating System is designed precisely to help with this discovery process. It acts like a detective, turning raw data into meaningful insights that reveal the hidden patterns and market shifts you need to see. By automating this “Sherlocking” through advanced algorithms, the system frees you to focus on interpreting insights and prioritizing actions that unlock growth potential.
In my book Path to Growth and Profitability, I explore these ideas further—showing how technology can make strategic phenomena accessible, measurable, and actionable, empowering businesses to adapt swiftly to changing markets.
BACKROUND
When we started the development of 180ops, we recognized multitude of challenges that companies had in their everyday management and operations. The difficulties companies have result in operational and management inefficiency as well as in insufficient capabilities and fragmentation. In an overall performance, these challenges manifest themselves in sub-optimal growth and profitability of a company.
How can these challenges be addressed? There are four ways:
1. FROM INSIDE-OUT TO OUTSIDE-IN
If you think about any internal management tool from ERP to different types of dashboards, they are all concentrating on some internal object. The object can be company’s financials overall, business unit, offering, channel, sales team, salespeople.. The tools can report how things are moving, but they CAN’T explain why.
The major difference in the 180ops approach is that we are modeling individual business IDs and offer abottom-up and outside-in perspective to management. Each individual customer is like a sensor in the markets influenced by three forces that we are concentrating on in our analysis:
- The customer’s relationship: What are they buying, what is happening in their customer relationship
- What is going on with the company in general: is it growing, declining, hiring, laying off, expanding to new markets, M&A,..
- What is happening in the macro economic environment these companies operate in: What is happening with inflation, interest rates, energy prices, business confidence index, consumer confidence index, market volatility, GDP, employment..
These three types of dataset enable AI and algorithms that we are using analyze what and why is happening and enable management to adapt to the surrounding markets. This is more important now, than ever because the economic policy uncertainty has reached all time high levels. Markets are being devided to winners and losers faster than ever and both the risk and opportunity in the markets are higher than ever.
When 9/11 and the collapse of Lehman Brothers happened and started a financial crisis, it felt like the world was derailed and nothing would be same again. However, that was only a warm-up. Currently, we are experiencing the highest uncertainty levels ever. When Hamas attacked Israel, the volatility level hit a new record.
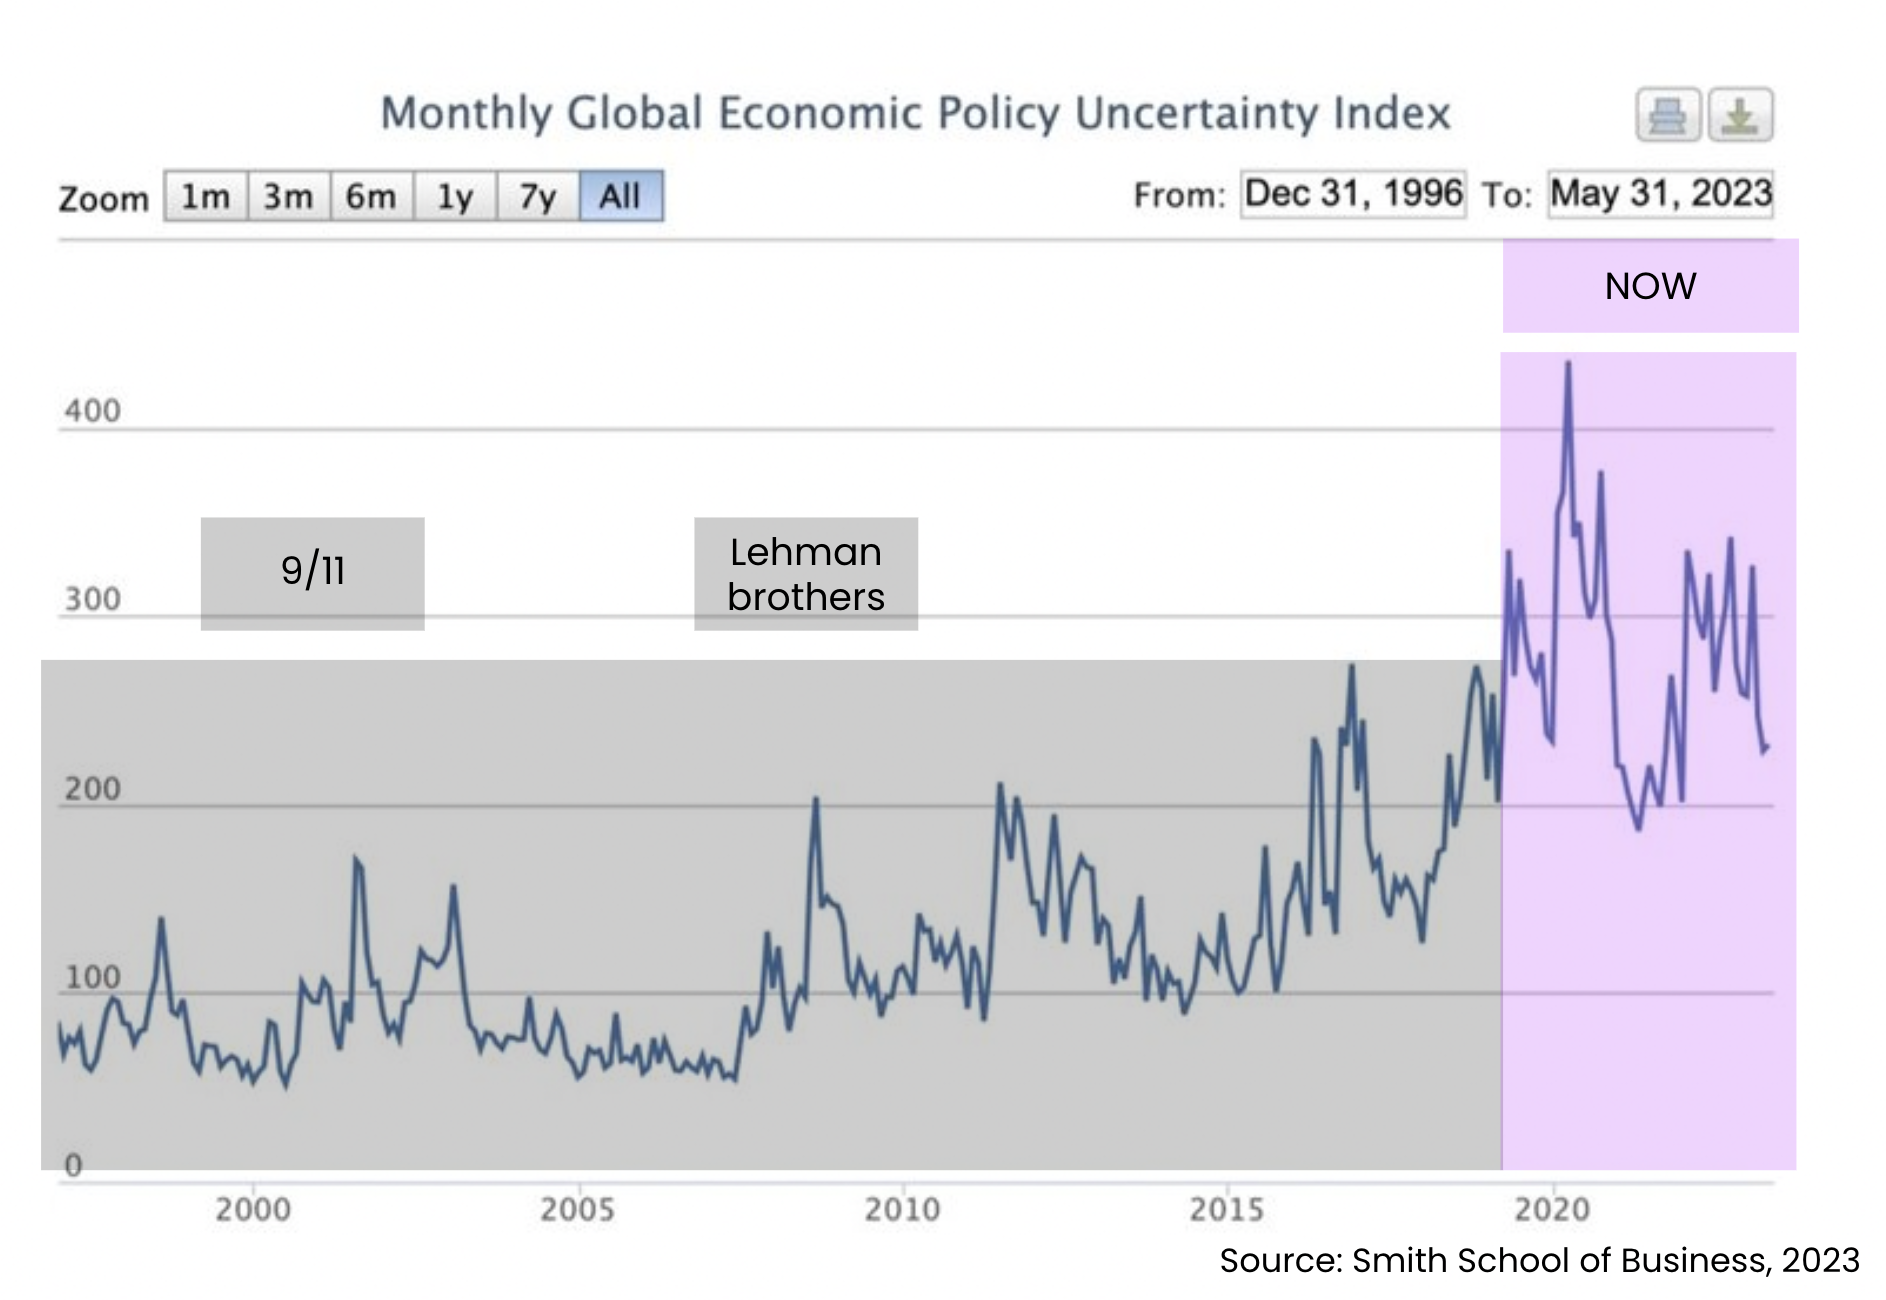
If we think about how burnouts have reached epidemic levels and how people feel ill at work at the moment, the VUCA reality (Volatile, Uncertain, Complicated and Ambiguous) has major role in it. We have an innate need to feel in control, understand what goes around us and how to adapt to the situation. When we understand what is happening, we can determine our action to it and feel in control. This is not just about profit and loss, this is about how we can make peoples’ lives better.
2. CLOSING THE GAP FROM TOP-DOWN TO BOTTOM- UP
There is a great gap between how management sees the markets (TOP VIEW) and how operational people face it (STREET VIEW). This is imperative in strategy design and in eg. defining the budget and goals for the next year.

When management analyse the market, they look at the market environment, expected growth or decline in certain areas and set an expected success level in them. This is quite hypothetical and abstract approach. When these goals are then dived for business units, offerings, channels, sales teams and sales people, they have two questions that need to be answered in detail:
- What is this budget based on, AND
- How can I make or exceed it?
Answering these questions is imperative, because in uncertain environment people feel stress like never before and if they can’t answer those questions, they are likely to leave their job. The biggest reason salespeople are leaving is because they thought that the quotas and goals were unrealistic. This is where the gap has its worst impacts: If we look at the projected sales for sales person A’s named customers, it could be 20% positive growth, this person is happy and can relax. Now lets look at the projected sales for person B, it could be 20% negative, which means that this person needs to first recover from the negative development AND gain the expected growth. This is when people lose hope and check out.
180ops has the answers to how to close the gap and enable bottom-up budgeting. It starts from the individual customer level:
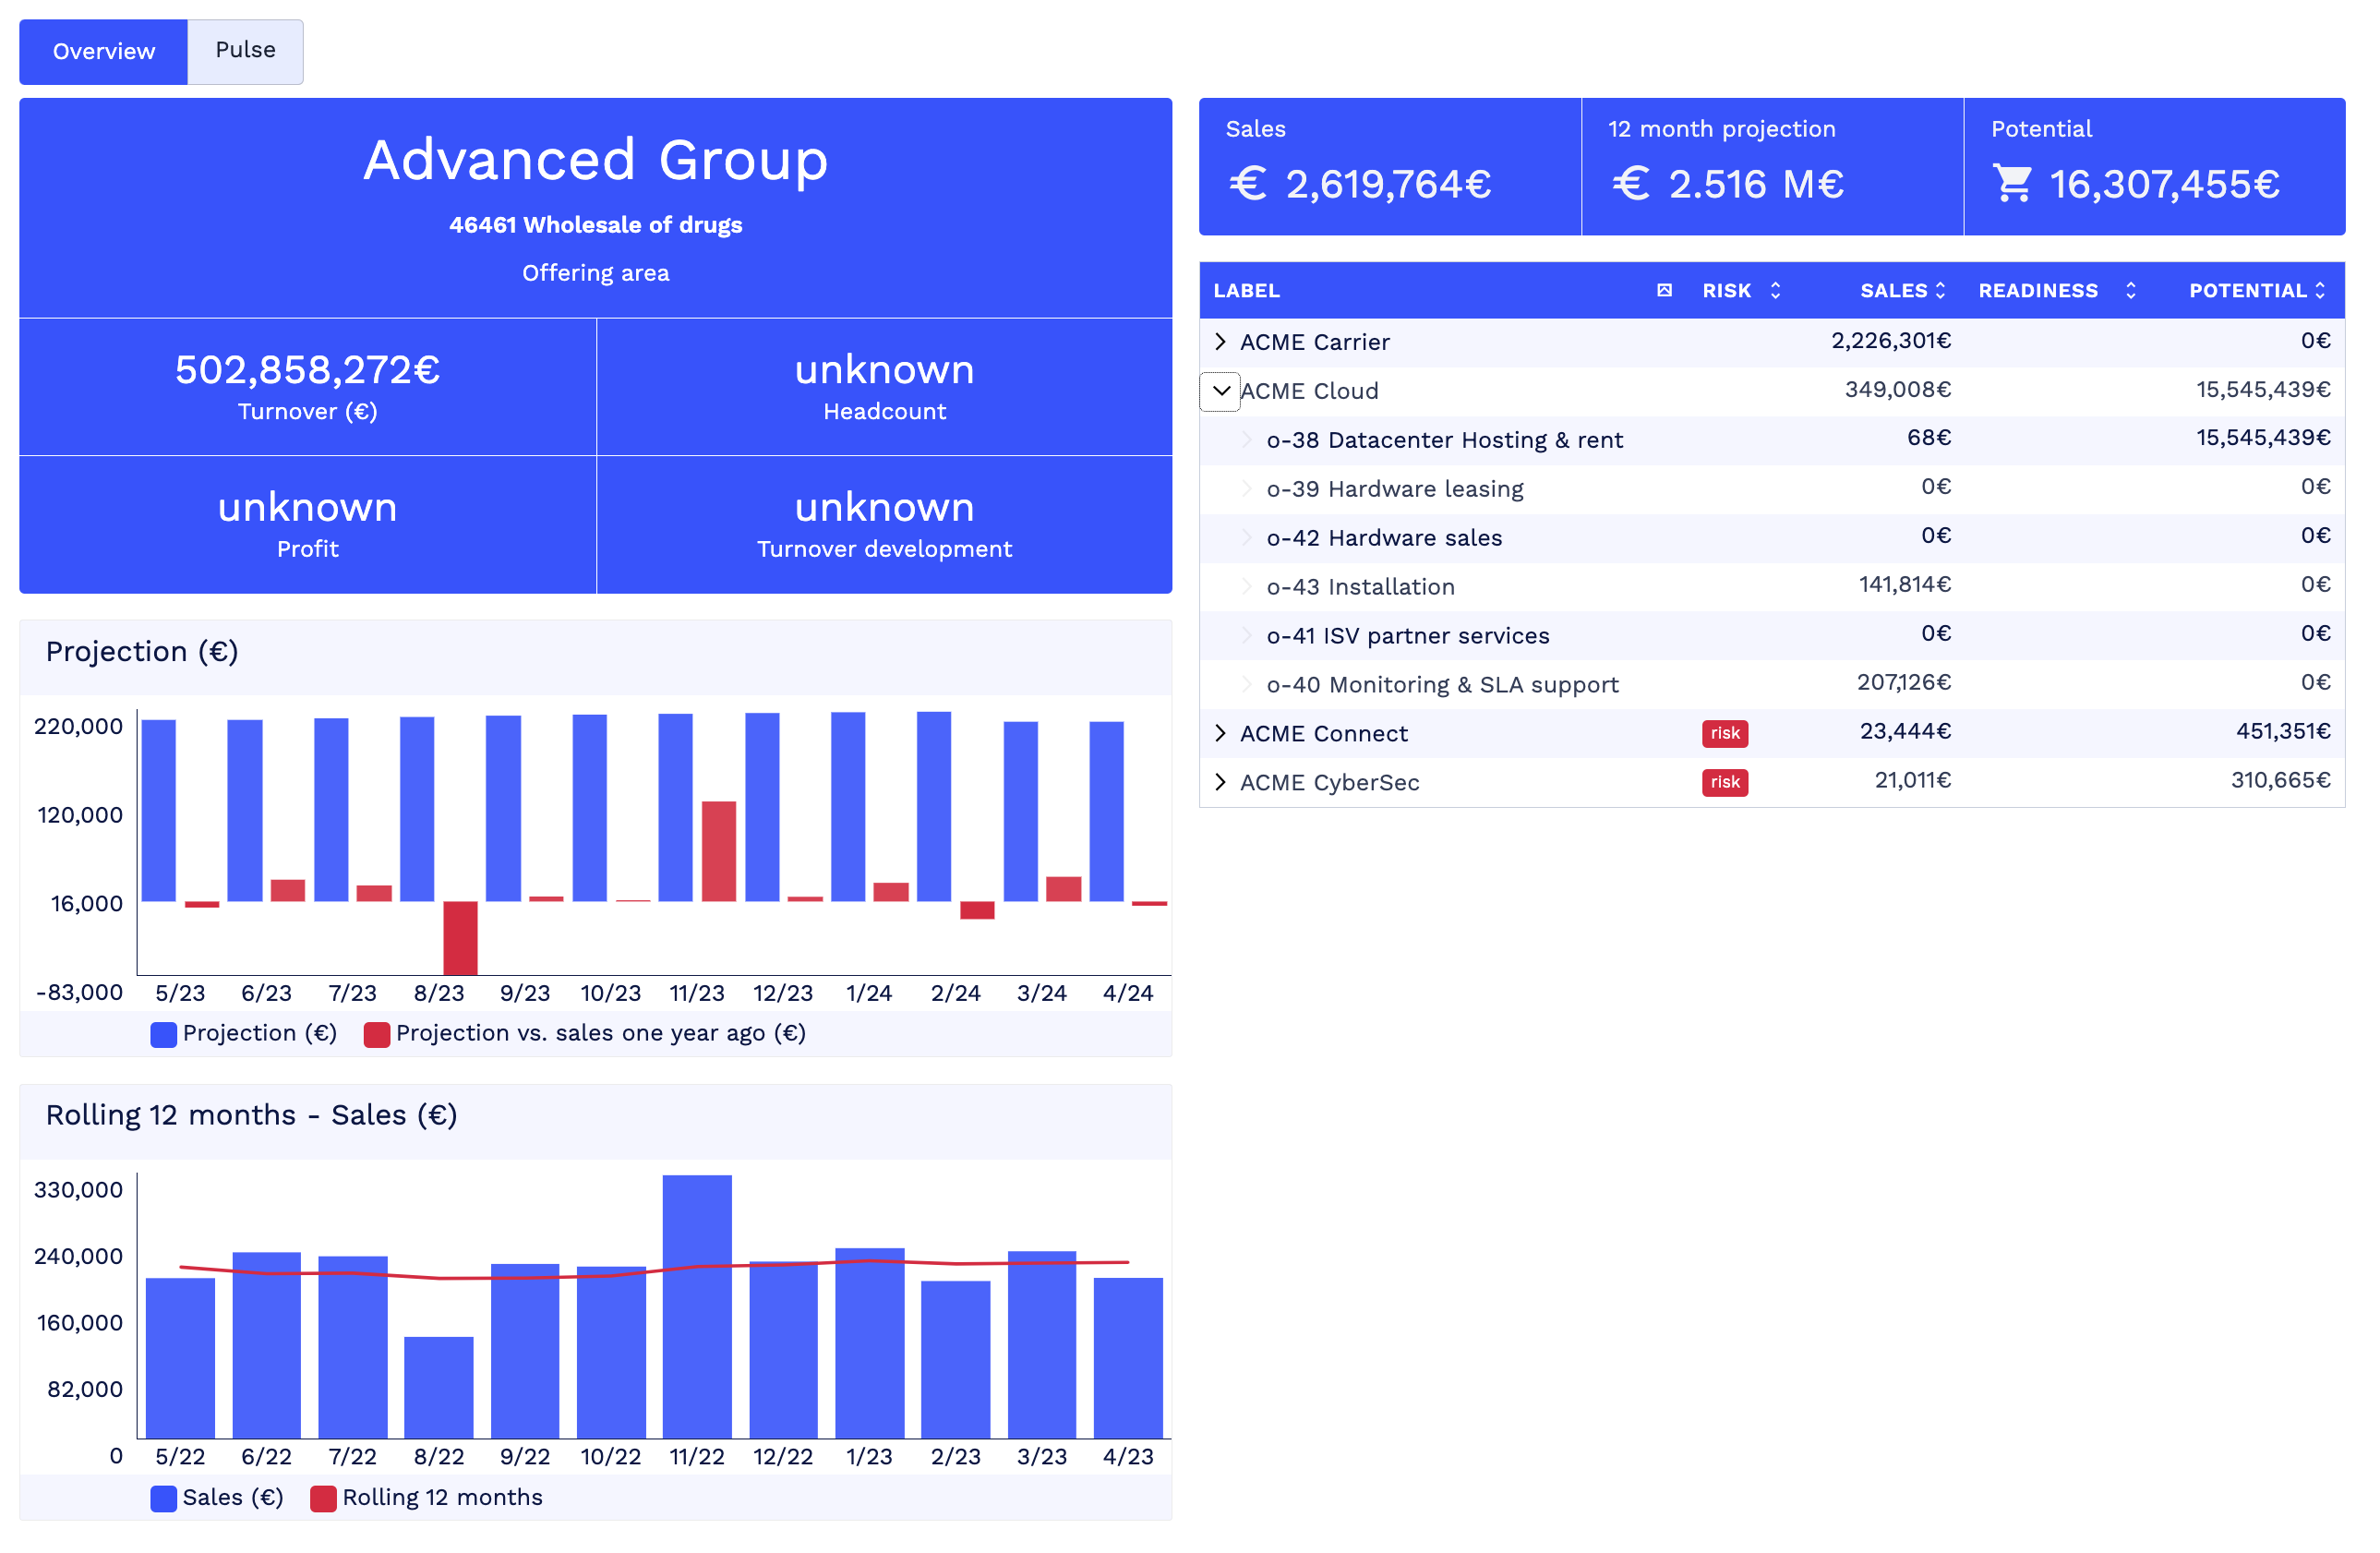
This view gives clear status for the customer: What has been the last 12m billing, rolling 12months billing development, how does the next 12m look like, how much and where is th growth potential, is there risks or readiness to go after right now.
When these individual customers are aggregated at macro economic market level, the management gets an overview on current state, potential, priorities, risks and opportunities. The key answer to deliver is, where to address your resources to gain optimal growth with least friction. This approach also closes the gap between executive view and operational street view perspectives.
3. SHARED PERSPECTIVE AND LANGUAGE
The 180ops key promise is to answer these four primary questions:
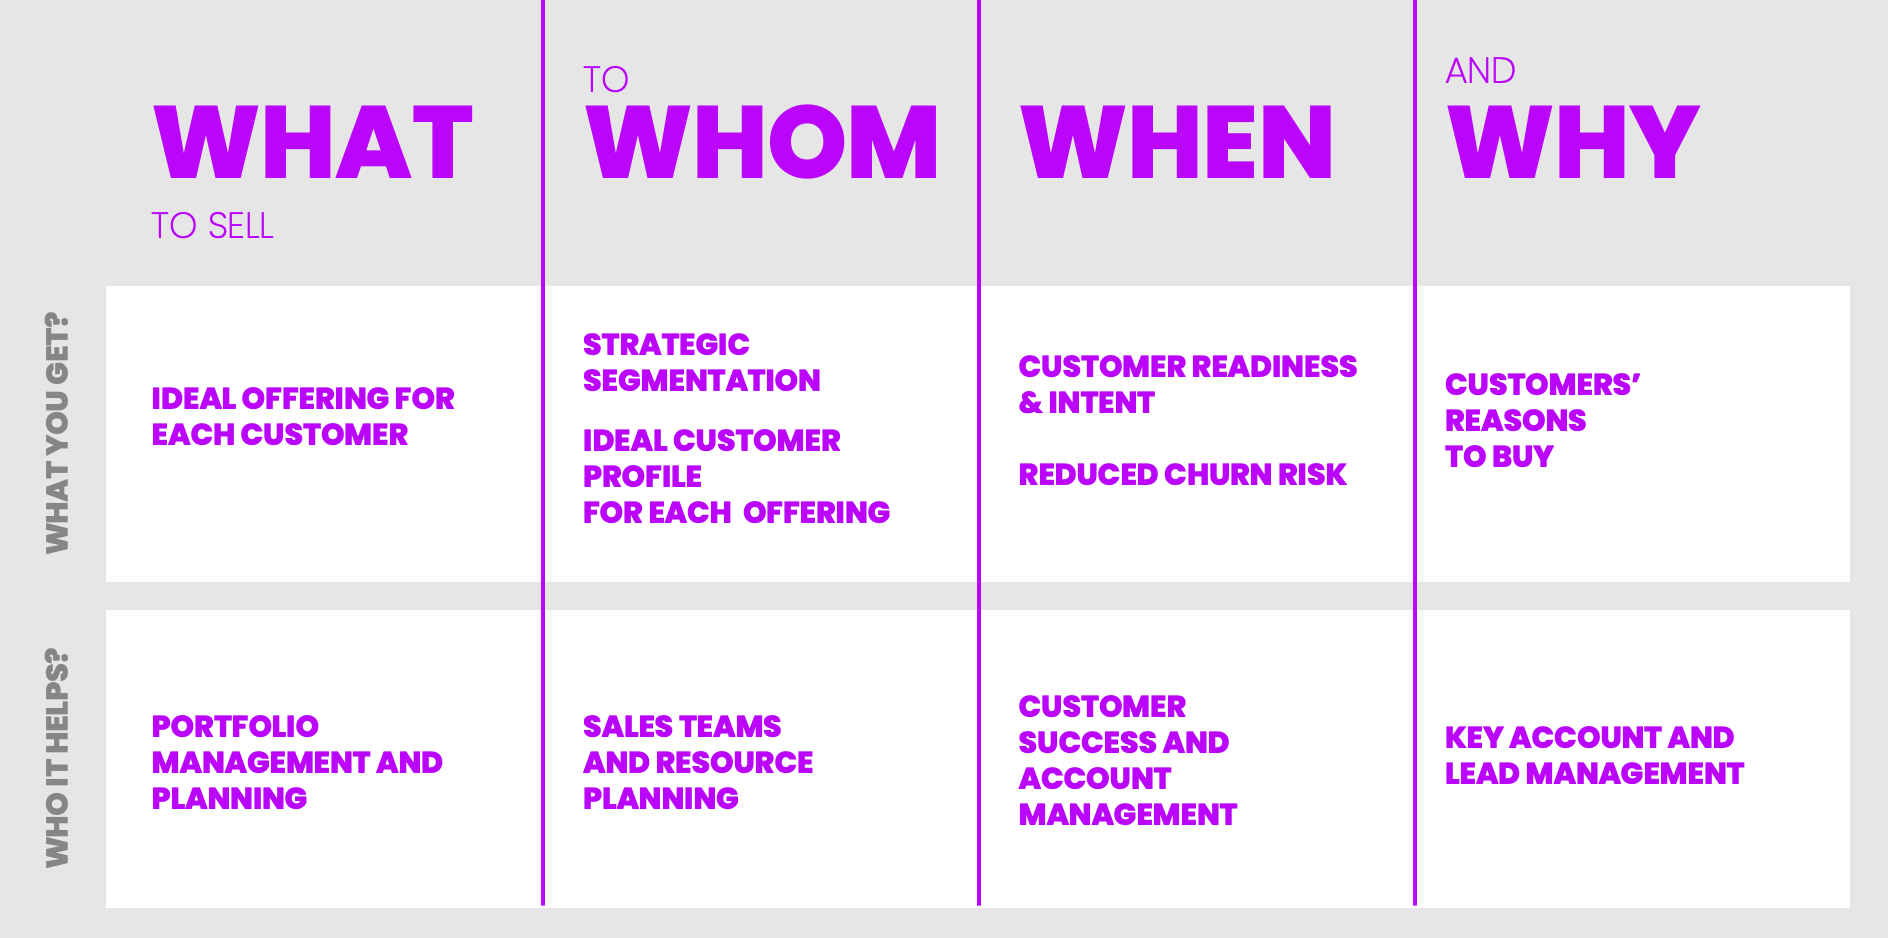
Answering these four questions creates a shared understanding in the company, about how do we maximize and optimize the value of our current capabilities. Evidence based analytics can only answer questions, that have a history. Finding answers to question regarding completely new offering development require other tools to answer. However, in every single case that we have encountered, there has been new insights to discover from existing offerings and capabilities.
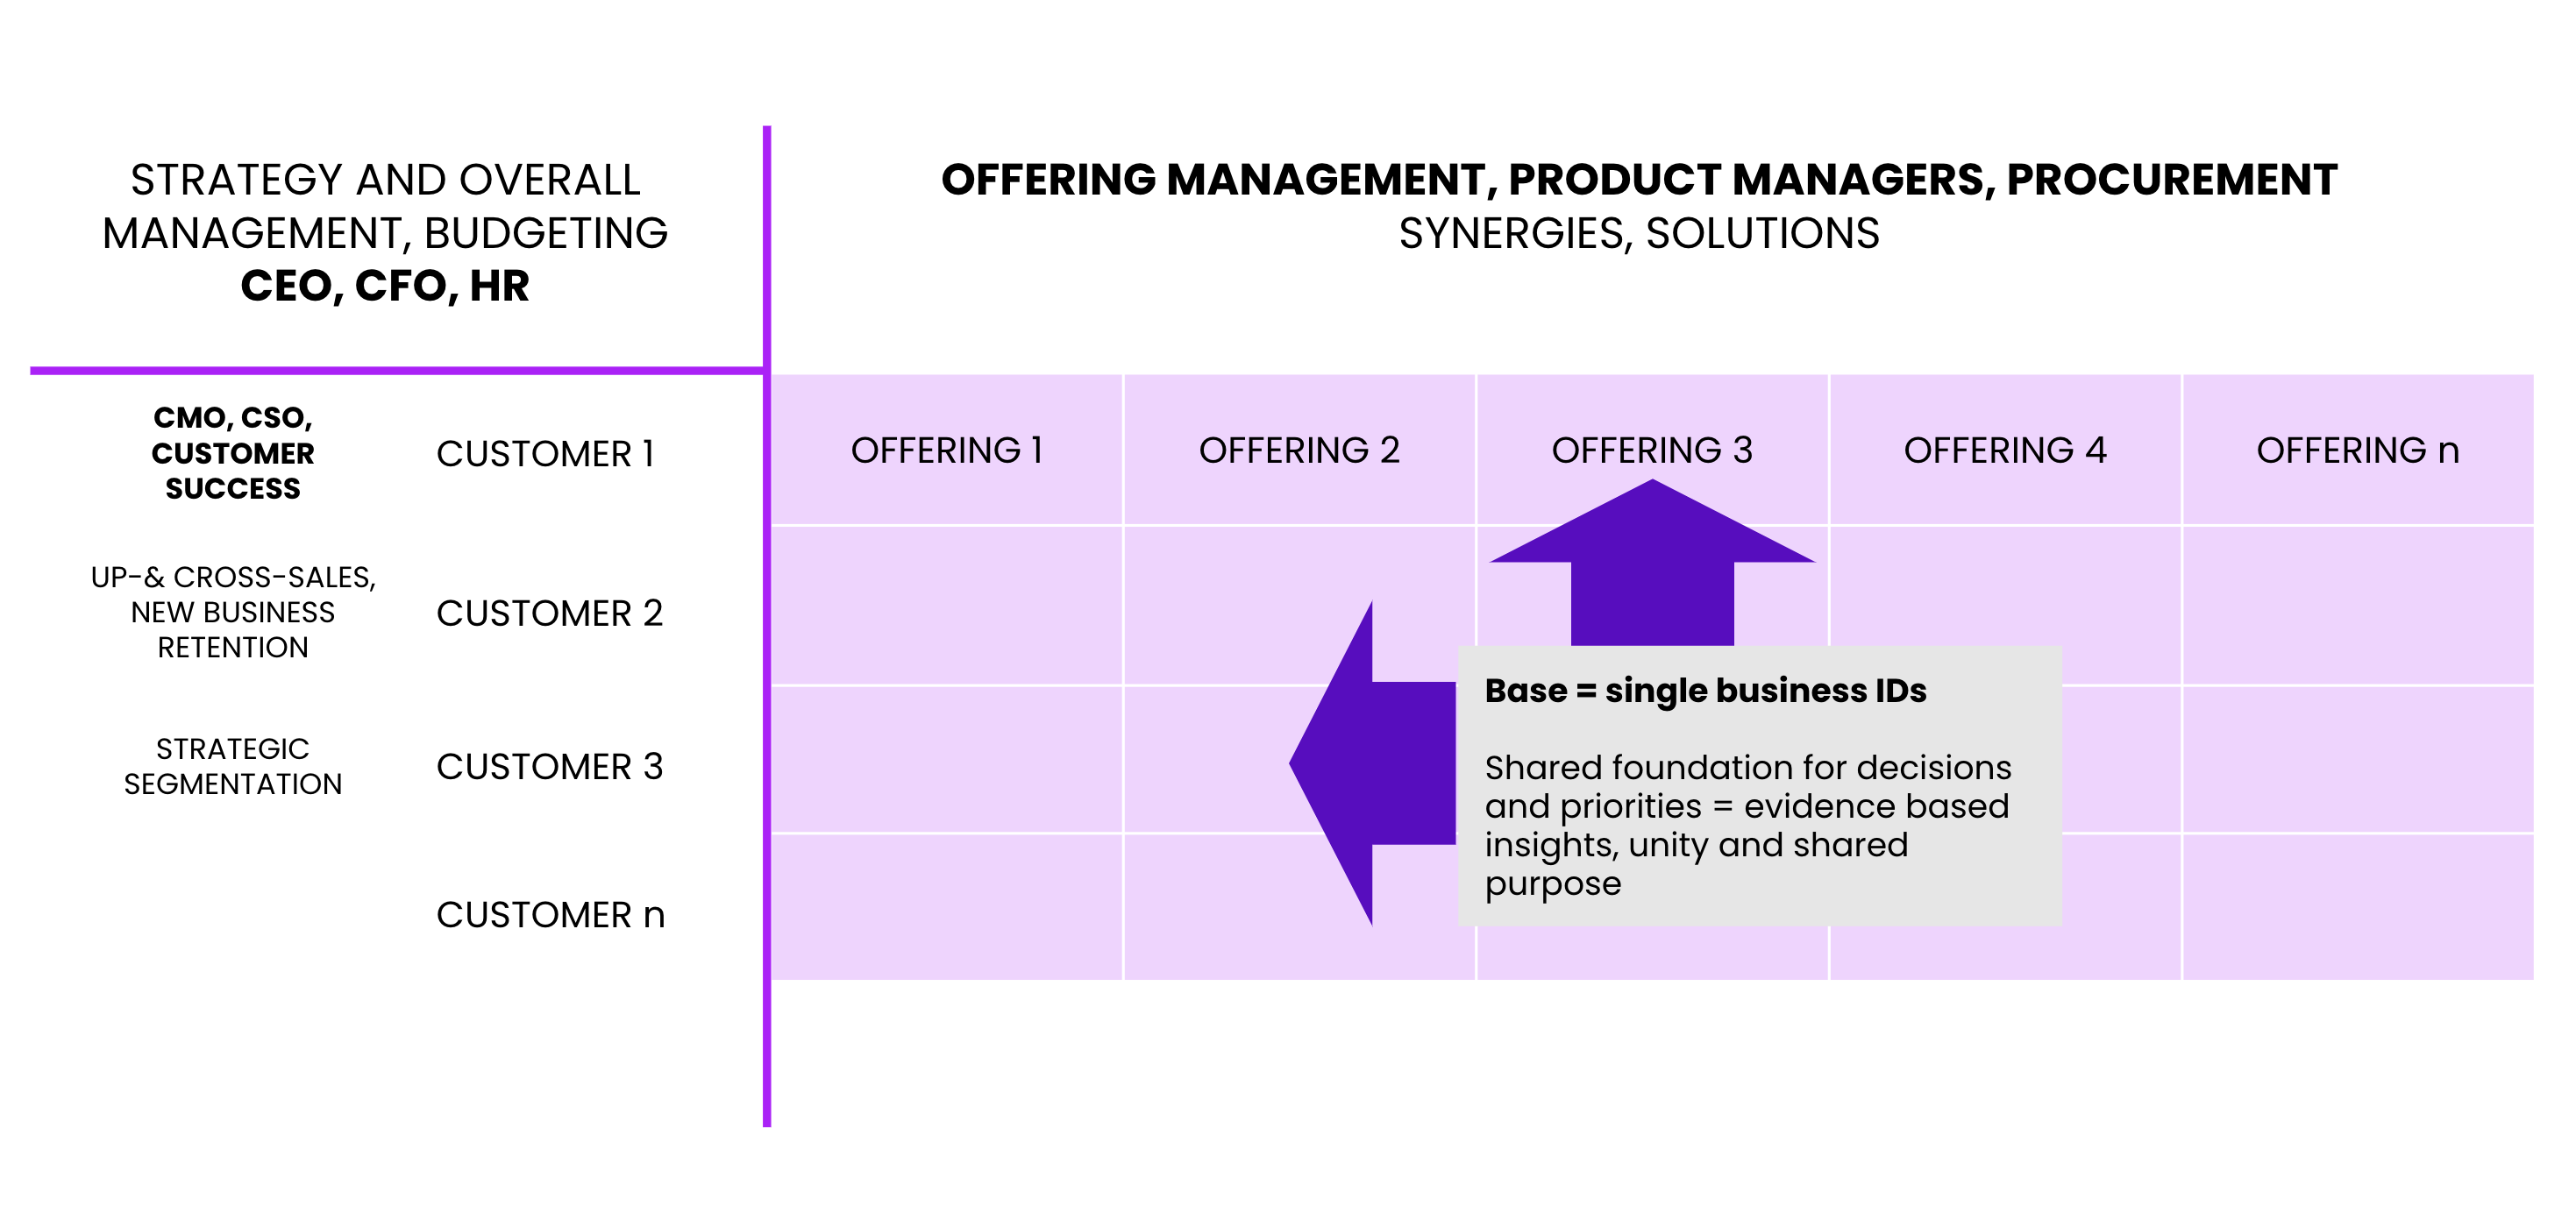
The shared perspective and source of KPIs if founded on facts and evidence from the markets. The BusinessIDs that we analyse form the foundation for looking at the data from multiple points of view across stake holders in a company. Approaching the analysis bottom-up and outside-in is an enabler of shared understanding and it closes the gap between management and operations. This is what Revenue Operations Management in our thinking really stands for.
4. TIMING FACTOR
We made it our mission to find new ways how to create a tool that would aggregate data, analyze it with algorithms and deliver answers that alleviate the challenges and create a shared view to the markets, risks and possibilities. The process of discovering and learning can be pictured as AI-augmented Double Diamond process. Enabling a shared view is about unity, collaboration and synergies instead of different KPI’s and turf wars. Commercial Management OS is not a new ERP or CRM, its role is to aggregate data from different internal and external data sources and deliver meaningful answers. Primary question to answer is: “Where is the growth” which is about connecting portfolio with markets. To make answers more actionable we also need answers to more advanced questions: “Why these companies, what makes them opportunities or risks right now”, which takes us to timing related question “When” and resource allocation related question “How”. (See figure below)
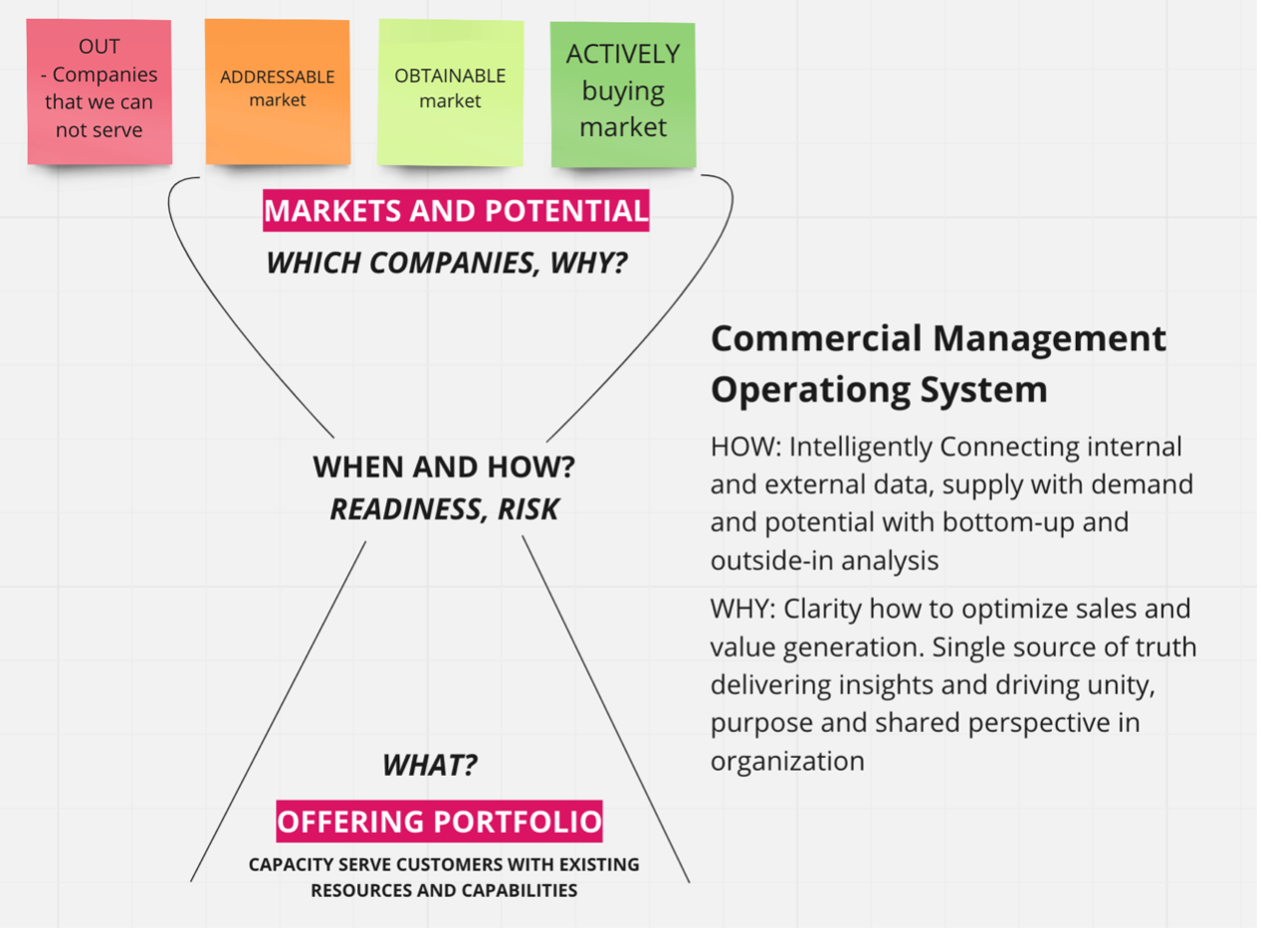
These answers create a bridge between strategic decision making and everyday operational management. The big bold value promise that we are redeeming is that we help our customers to succeed by providing them a new perspective; a single source of truth, a platform that defines priorities and narratives that brings everyone together.
One highly beneficial feature is that we are analyzing everything in monetary form. Value in terms of turnover, potential, risk and opportunities need to be presented in hard currency. The question, “Where’s the money?” needs to be answered. Everything else is just noise.
Potential in this context means 100% market share with the current portfolio. When we look at the market in monetary terms by industry classification, we can prioritize target groups and sectors. This is much more inspiring approach because different business sectors and companies will have very different potentials. What this analysis can not analyze is market saturation. We need specific data about customer’s need status, whether their need is already satisfied or not. This question will enable us to divide market to addressable, obtainable and active markets. Some offerings could be older and widely adopted which means that winning market share is about replacing competitor.
READ MORE: How to segment markets by urgency: Addressable, Obtainable and Active Markets
Our role is to aggregate company’s own data, combine it with external data sources (Outside-in) and use algorithms to make sense of it all. More about this combination here: Next Generation Intelligence – AI-augmented Double Diamond
WHO IS 180ops FOR?
The modeling learnS from history (time series analysis), which means that that this approach offers optimal value for large and midcap B2B companies that have history, a wide offering portfolio, lots of customers, and diverse customer types. If the company has a group structure, subsidiaries, divisions or M&A history, the benefits are likely to be even stronger. These types of companies are most likely to have un-tapped synergies, blind spots, inefficiencies and potential to make a major impact on growth and profitability.
Our tools and analysis allow companies to make most of what they already have and create a solid platform from it. However, this approach doesn’t give direct answers to questions about innovation related questions directly. However, it can help us quantify addressable market potential that we just can’t plug-in to yet. Discovering how we change that can help innovate new and win new market share.
MAKING SENSE OF DATA AND DELIVERING IT WHERE IT IS MOST NEEDED
Our focus is to answer critical questions on a single spot and also to distribute new answers to tools that the company’s employees are already using. This makes the adoption faster and easier, time to impact is much shorter. There are other tools that are widely used for financial and profitability management and commercial management OS’s role is not to replace solutions that work but bring new answers. The views to the data and the advice available from 180ops should be made available where they are most needed: in a CRM or contact center tools, for example. The new data and advice this technology produces maximal impact when used with other tools that the company is already using, eg. In marketing automation and reporting.

One way of defining what Commercial management OS is the central brain. It doesn’t make automated choices, but it delivers the data and answers for the persons deciding or planning and enable triggering of activities in other technologies.
Most companies’ management has aspiration to become more data-driven and create solutions to make decisions based on numbers and facts. The work is often quite company-specific, slow, and expensive. This is not just technical challenge, because analysts and data scientists are notoriously scarce resources to hire and even if you have been able to hire them, most of their time is often spent in ways that are less than optimal (eg. reporting and making lists to various needs). The tool also meets utility requirements and alleviate the resource scarcity related challenges.
PLATFORMIZATION
We recognize that there is a clear need for a low risk and cost-efficient tool that can be rapidly deployed, gives answers to strategic questions as well as tactical and operational, has strong utility value and support the creation of shared view and purpose, sense of unity.
THERE ARE THREE PERSPECTIVES TO WHERE AND HOW WE DELIVER VALUE TO OUR CUSTOMERS:
1. UTILITY VALUE: PRODUCTIVITY
- Rapid deployment, speed to impact
- Easy access to data and rapid answers
- Reduced reporting needs
- Automated data distribution to where it is needed most, upgrading the capabilities of existing tools
- Free analysts from excel production and free their time to answer priority questions
- Reduce the pain of not having enough analyst resources
2. STRATEGIC VALUE: INSIGHTS, DISCOVERY AND MEASUREMENT
- Discover where the growth comes from: what to sell to whom, why and when
- Bottom-up and outside-in driven insights are a game changer
- Monetization of potential – Everything analyzed in hard currency
- Capacity to do company wide offering management and strategic segmentation
- Improved capacity to understand impacts, set goals and priorities
- Measure what matters most: Continuous access to trends and developments, effortless monitoring of direction
3. CULTURAL VALUE: SHARED PERSPECTIVE, UNITY AND PURPOSE:
- Bridge between strategic decision making, tactics and operations
- Drive open and inclusive culture, scale innovation potential
- Customer and market centric KPIs driving shared perspective, unity and purpose
- Glue between development programs, business units and spesialists
- Empower, inspire and energize teams with purpose, unified goals and synergies
Interested in learning more? Check out a demo of our product here.
Learn more:
Boost your productivity with RevOps
Succeed in your sales budgeting
Why AI + machine learning + Strategic Segmentation = Productivity
Next generation of Datadriven intelligence by connecting internal and external data
How to allocate resources by current value and potential
How to segment markets by urgency: Addressable, Obtainable and Active Markets
INTERESTED IN DEMO, INTRODUCTION AND SPARRING?
Please, don’t hesitate to open dialogue. We are happy to help. Leave your contacts here