If you think about any management tool or dashboard, they all have one feature in common – the center of their focus is on some internal object: Company’s financials, business unit, offering, channel, campaign, sales team or salesperson. This allows you to monitor what is happening and changing, but it is very difficult to get to the “why” questions.
As fundamental data structure and strategy, everything is viewed inside-out and customer centric analysis is difficult.
180ops fundamental difference is about flipping the perspective 180 degrees and taking the data to customer and market driven operations.
What does customer and market centricity truly mean?
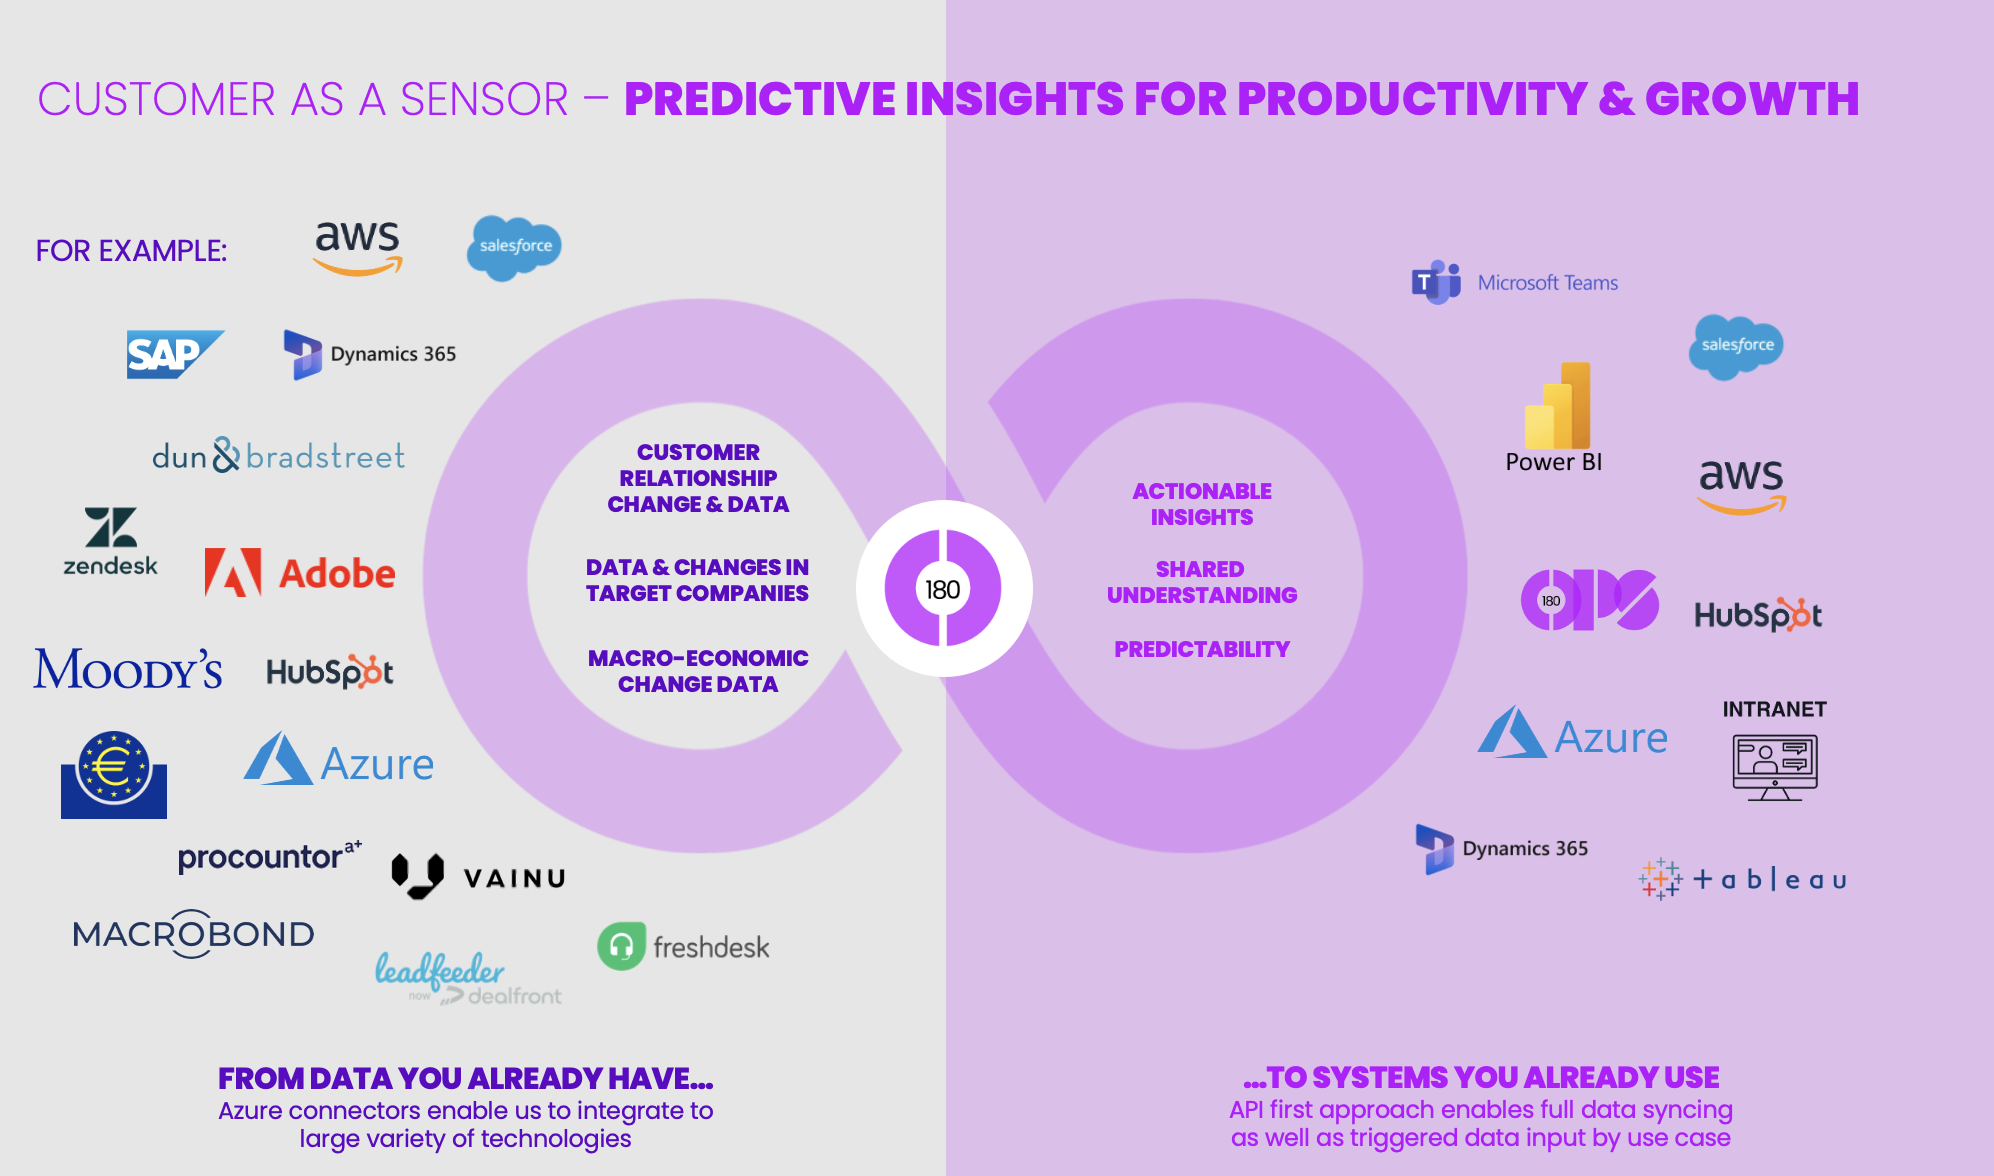
Focusing on customers means that the focus of all analytics is in customers, offerings are assets that are relevant for some of them. We consider customers as sensors in the market and analyze how a variety of changing factors influence sales potential, revenue forecasting, risk of defect or readiness to buy at offering level by individual Business IDs.
Discovering what kind of data is giving us insights and allows us to analyze correlation and causality is called the process of crafting a data recipe.
Datarecipe has three main components
#1 Own data about customers:
Customers have customer relationships, they buy and defect, they engage with the company in multiple ways, have interests, experience incidents, price increases, give reclamations. They show interest to some offerings by visiting offering pages online, download whitepapers or other materials, respond to campaigns, request a demo, participate in webinars etc.
This data is available from company’s own billing, CRM, marketing automation, ticketing and customer support systems and analytics tools.
#2 External data about companies:
These companies operate in certain standard industry class, have certain size and nature. They also change themselves, they hire and fire people, grow or decline, get funding, buy other companies or get bought, get better or worse credit rating. Companies are in constant change. If e.g. a company rapidly grows or declines in revenue, it can be a negative predictor for some offerings and positive for others. If a company has dozens of offerings and is serving diverse types of customers, figuring out how their offerings (assets) align with changing situations in customers is incredibly difficult. This is where technology, AI, ML and advanced analytics comes in handy.
This data is available from multitude of data vendors like DnB and Moody’s or new breed of data collection companies like Vainu, Dealfront, Leadforensics and ZoomInfo.
#3 Macroeconomic data:
The third dimension is the macroeconomic environment these companies operate in: Changes in inflation, interest rates, employment, GDP, energy prices, volatility, economic policy uncertainty, etc. have an impact on customers that then influence how companies are doing and how in effect that also influences the customers’ relationships and likelihood of defect or readiness.
Understanding change, recognizing correlation and causality requires a unique data recipe for each company.
The influencing factors in different business verticals can be dramatically different, which means that there isn’t a universal key to answers. Data recipe needs to be individualized and even in a single company, different offerings are influenced by different changes and a single change can have negative impact on one offering and positive on another.
180ops is a data processor that has platformized the technology in a way, that meeting customer specific demands can be met efficiently with mass customization and data recipe development. This results in significantly faster time to results, lower risks and lower initial human or monetary investments from start to benefits. Continuously learning technology also constantly improves its accuracy and capability to operate as a support intelligence for sales, CS, marketing and management.
CUSTOMER DRIVEN FOUNDATION – MULTIPLE LENSES
Customer centricity starts from the data architecture and -models. All data is produced and stored at individual customer ID and offering level. Center of gravity is on company ID’s (customers and new customer acquisition targets) and all data is connected to them.
When the foundation is in customer specific data, we can change perspective on how we approach the data and what we want to understand or get answers to. This is a functionality that no other analytics tool is currently providing => Single source of truth with capacity to answer questions from different stakeholders’ perspective.
MARKET ANALYSIS
Example questions:
1) In which sectors do we have most to win, where is the potential?
2) Is the potential in up- and cross-selling or new customer acquisition?
3) Where can I get most growth with least friction?
These are questions that management and Sales management often ask and are often difficult to answer. Let’s start answering: Growth planning for market analysis
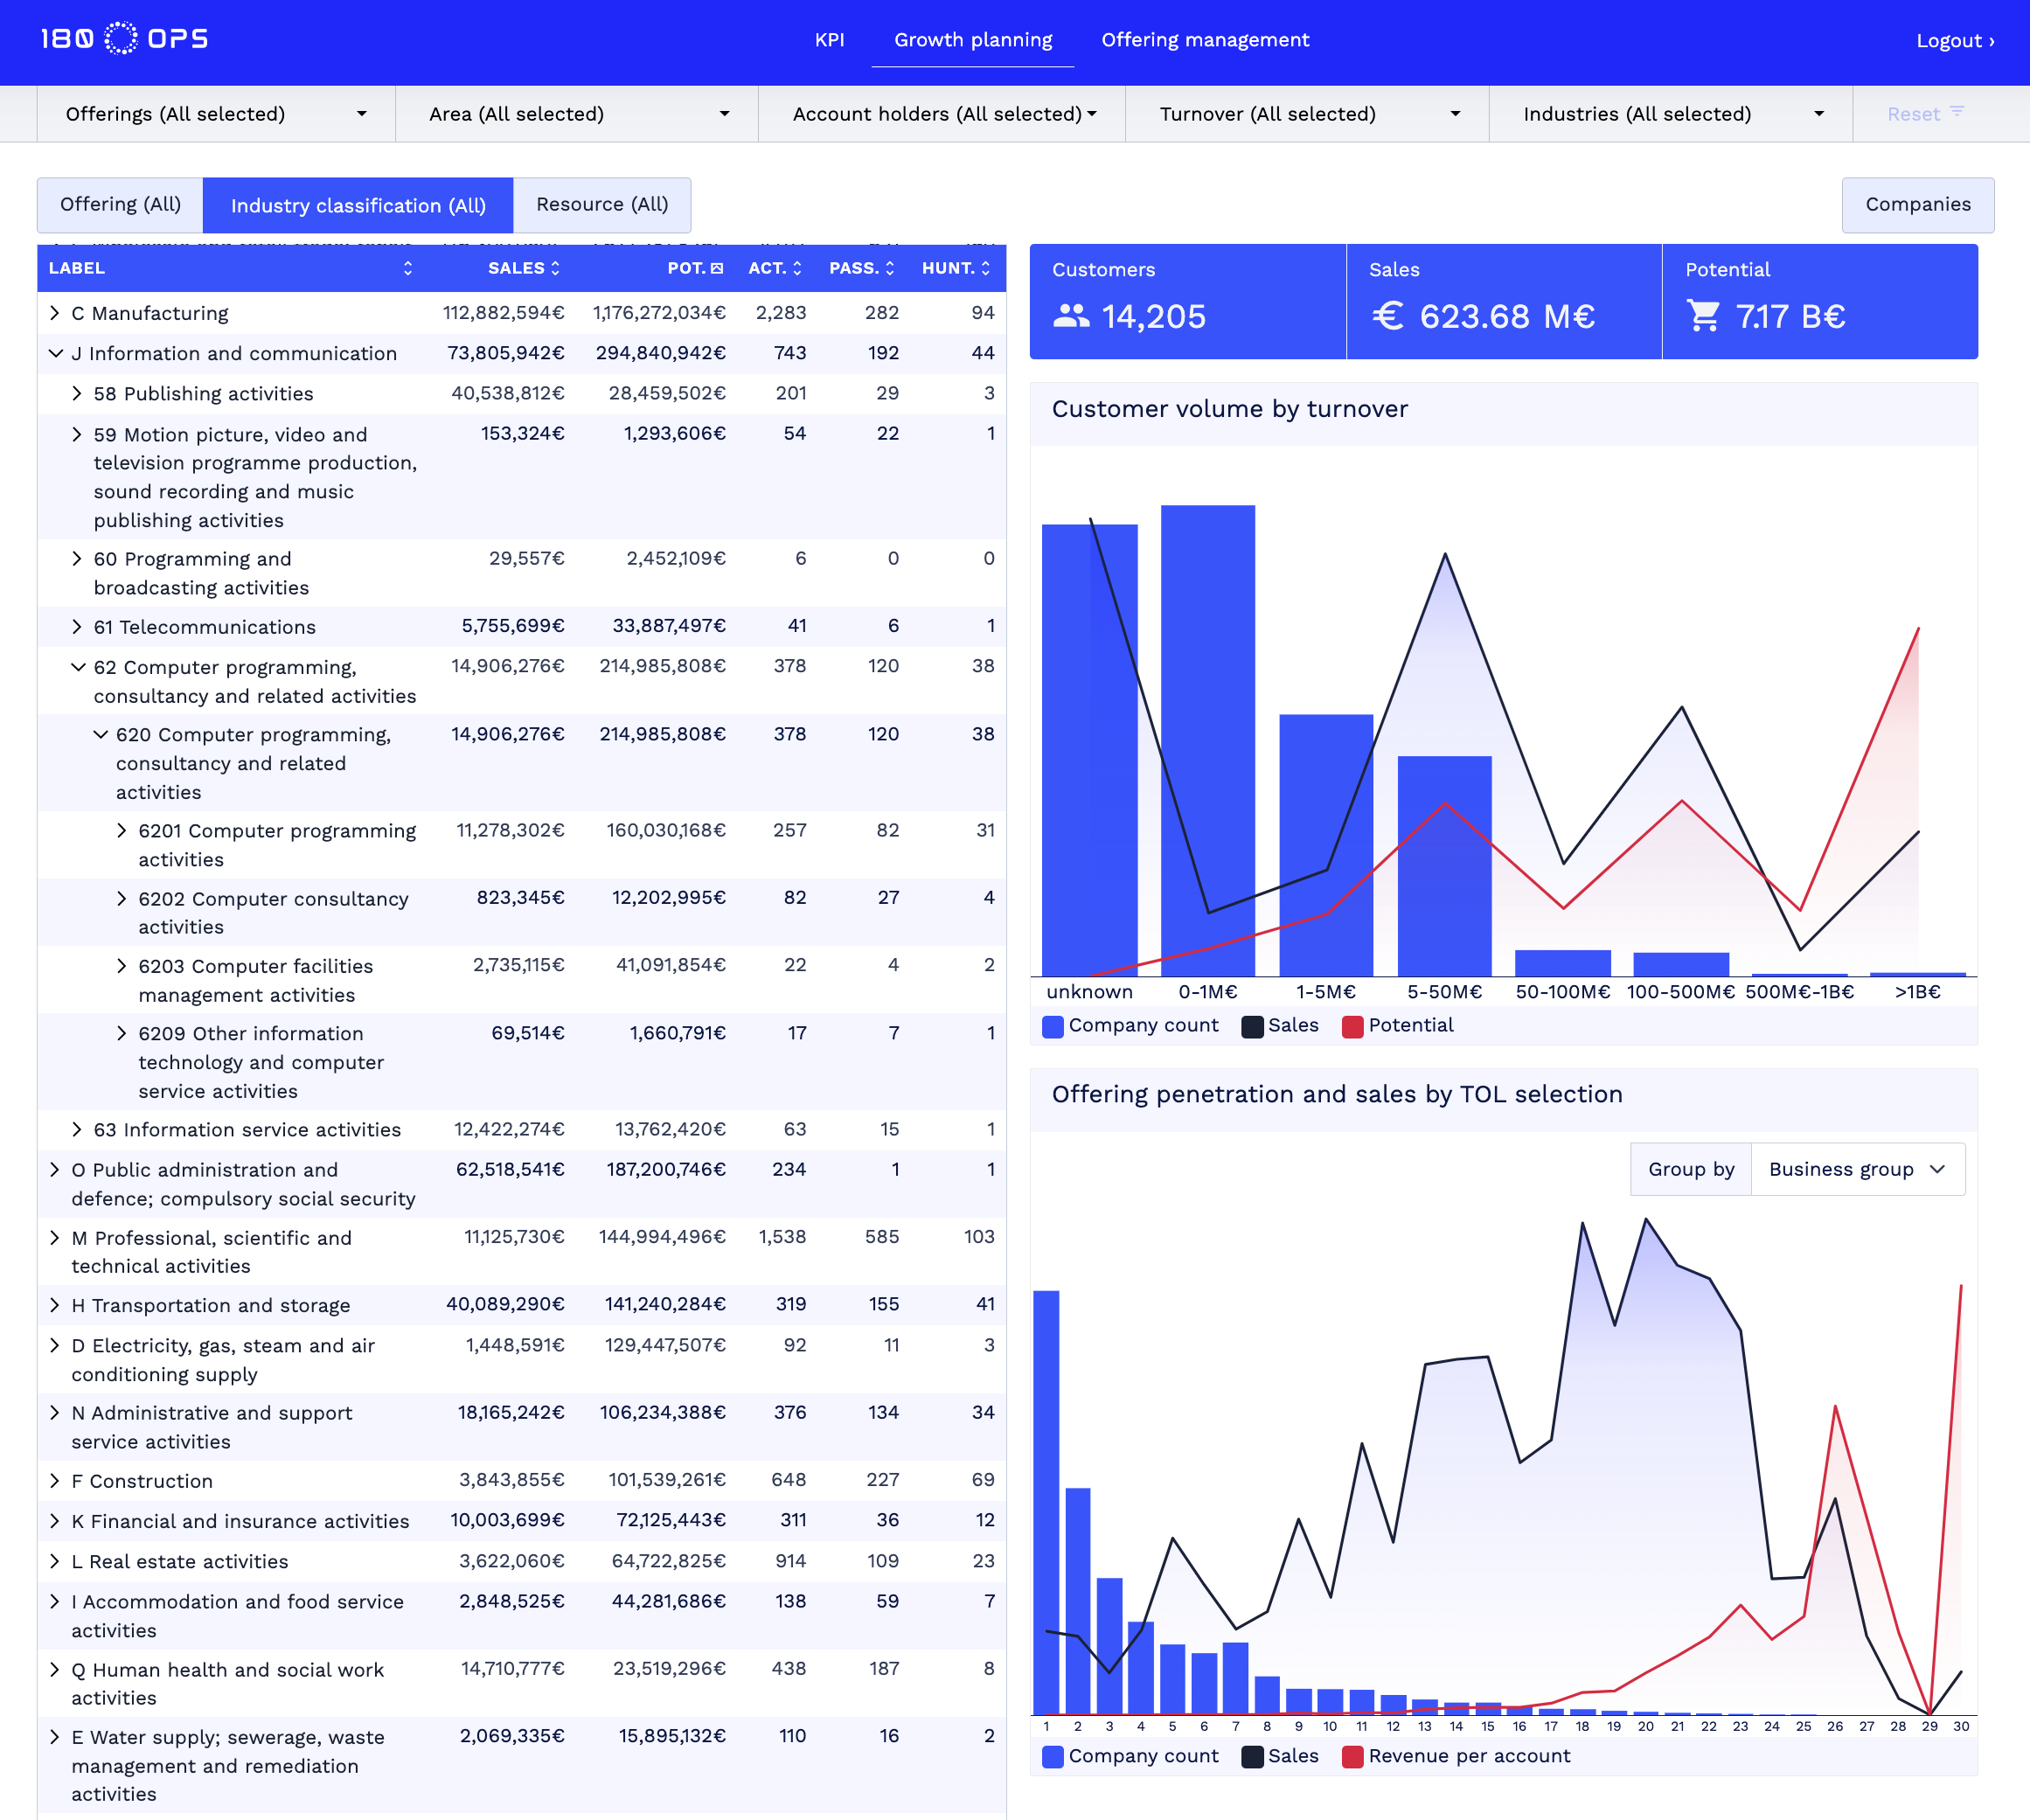
Note: this view is based on imaginary Teleoperator ACME Telecom, which has four business groups/subsidiaries and they all have different offerings. In this example there are more than 30 offerings
When we look at the companies by their standard industry classification, we can draw an overall view at third level of classification about what is the current level of 12 months rolling billing, billing potential, the number of active, passive and hunting target customers. The graphs also display how current billing and potential distribute across different company sizes by their revenue levels as well as displaying the level of offering penetration and distribution of billing by penetration and what is the average ARPA (Annual Revenue Per Account) level.
Analyzing markets has never been this easy. All figures are founded on evidence based analytics and represent 100% marketshare with the company’s offerings. By choosing some industry class, you are effectively choosing a lens – you want to analyze a market from that industry vertical’s point of view. You can then go to offering-tab and see what offerings in that vertical represent most billing and most potential. I selected “Manufacturing” main class from the previous view for show:
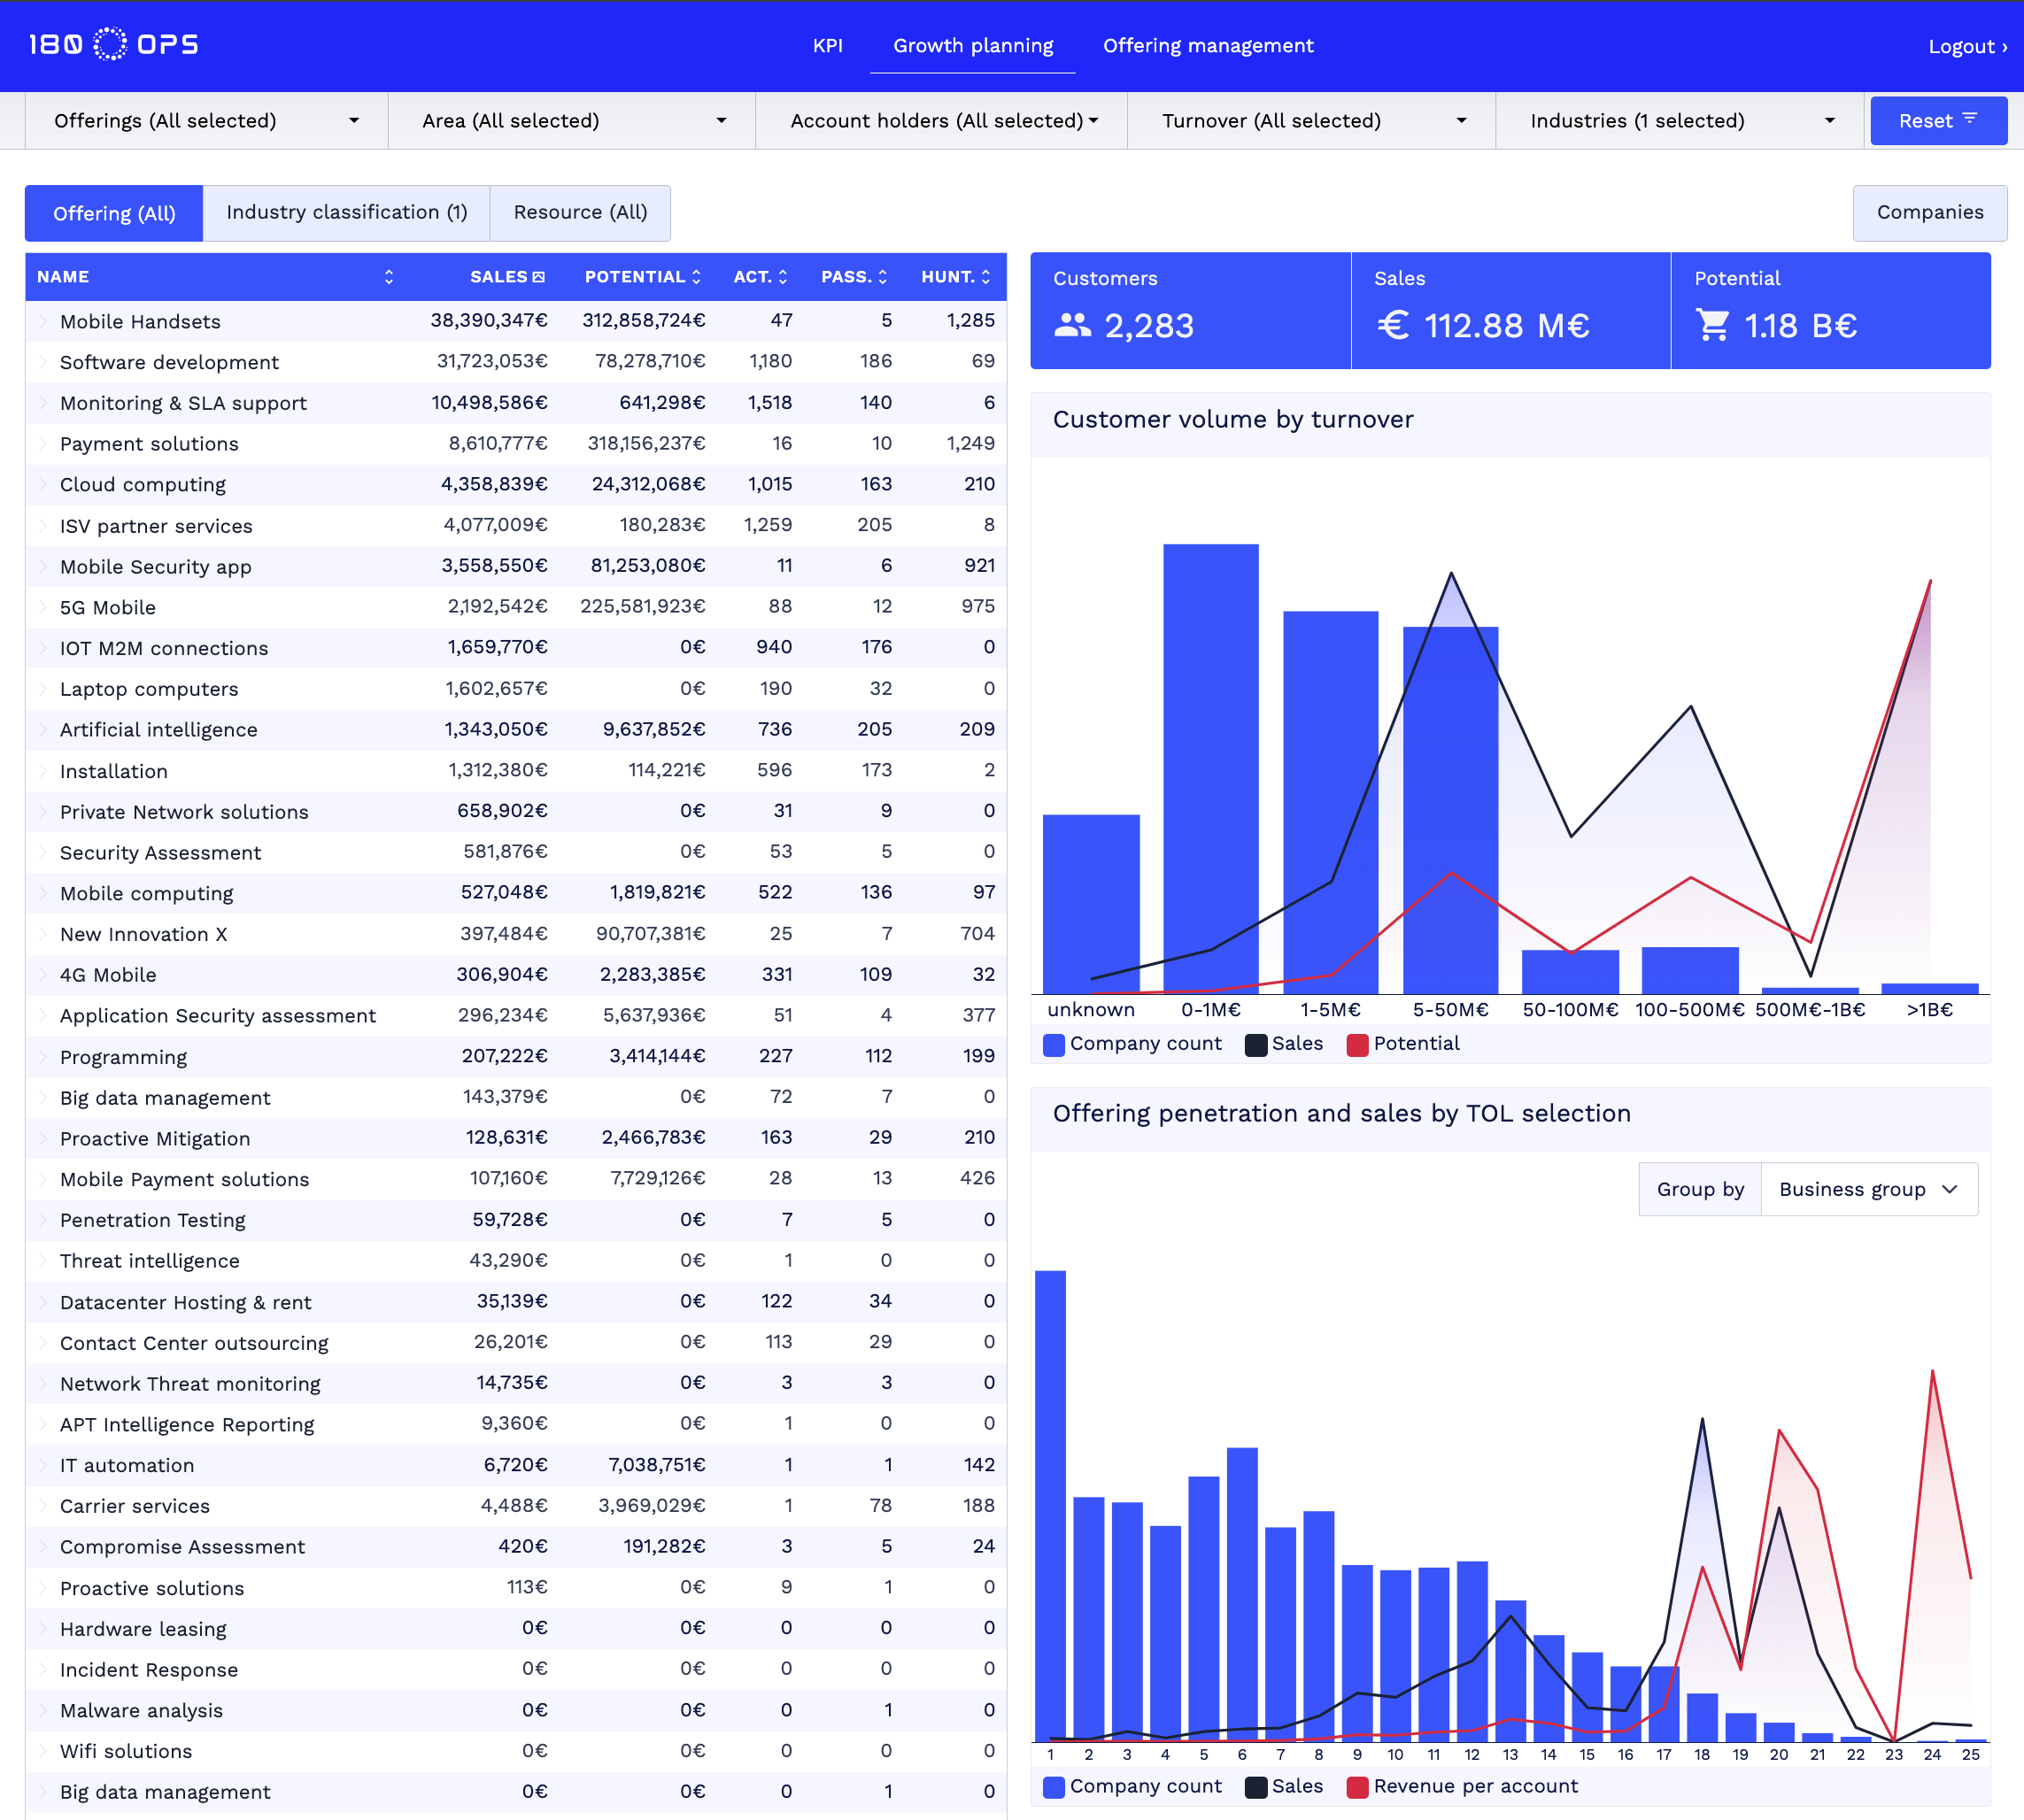
This view gives us an overview of what is happening with manufacturing customers. How many industrial companies are using different offerings, how many have passivated and how many new customer hunting targets do we have by offering. By choosing manufacturing customers, also the data visualizations changed and now show that the majority of billing comes from 5-50M€ and 100-500 million € companies, but the potential is largest in those >1B€. The penetration is higher than in average, but the largest ARPA is in customers that are using 18 offerings or more.
Now, if we find manufacturing interesting, we can view it at customer level in a list format:
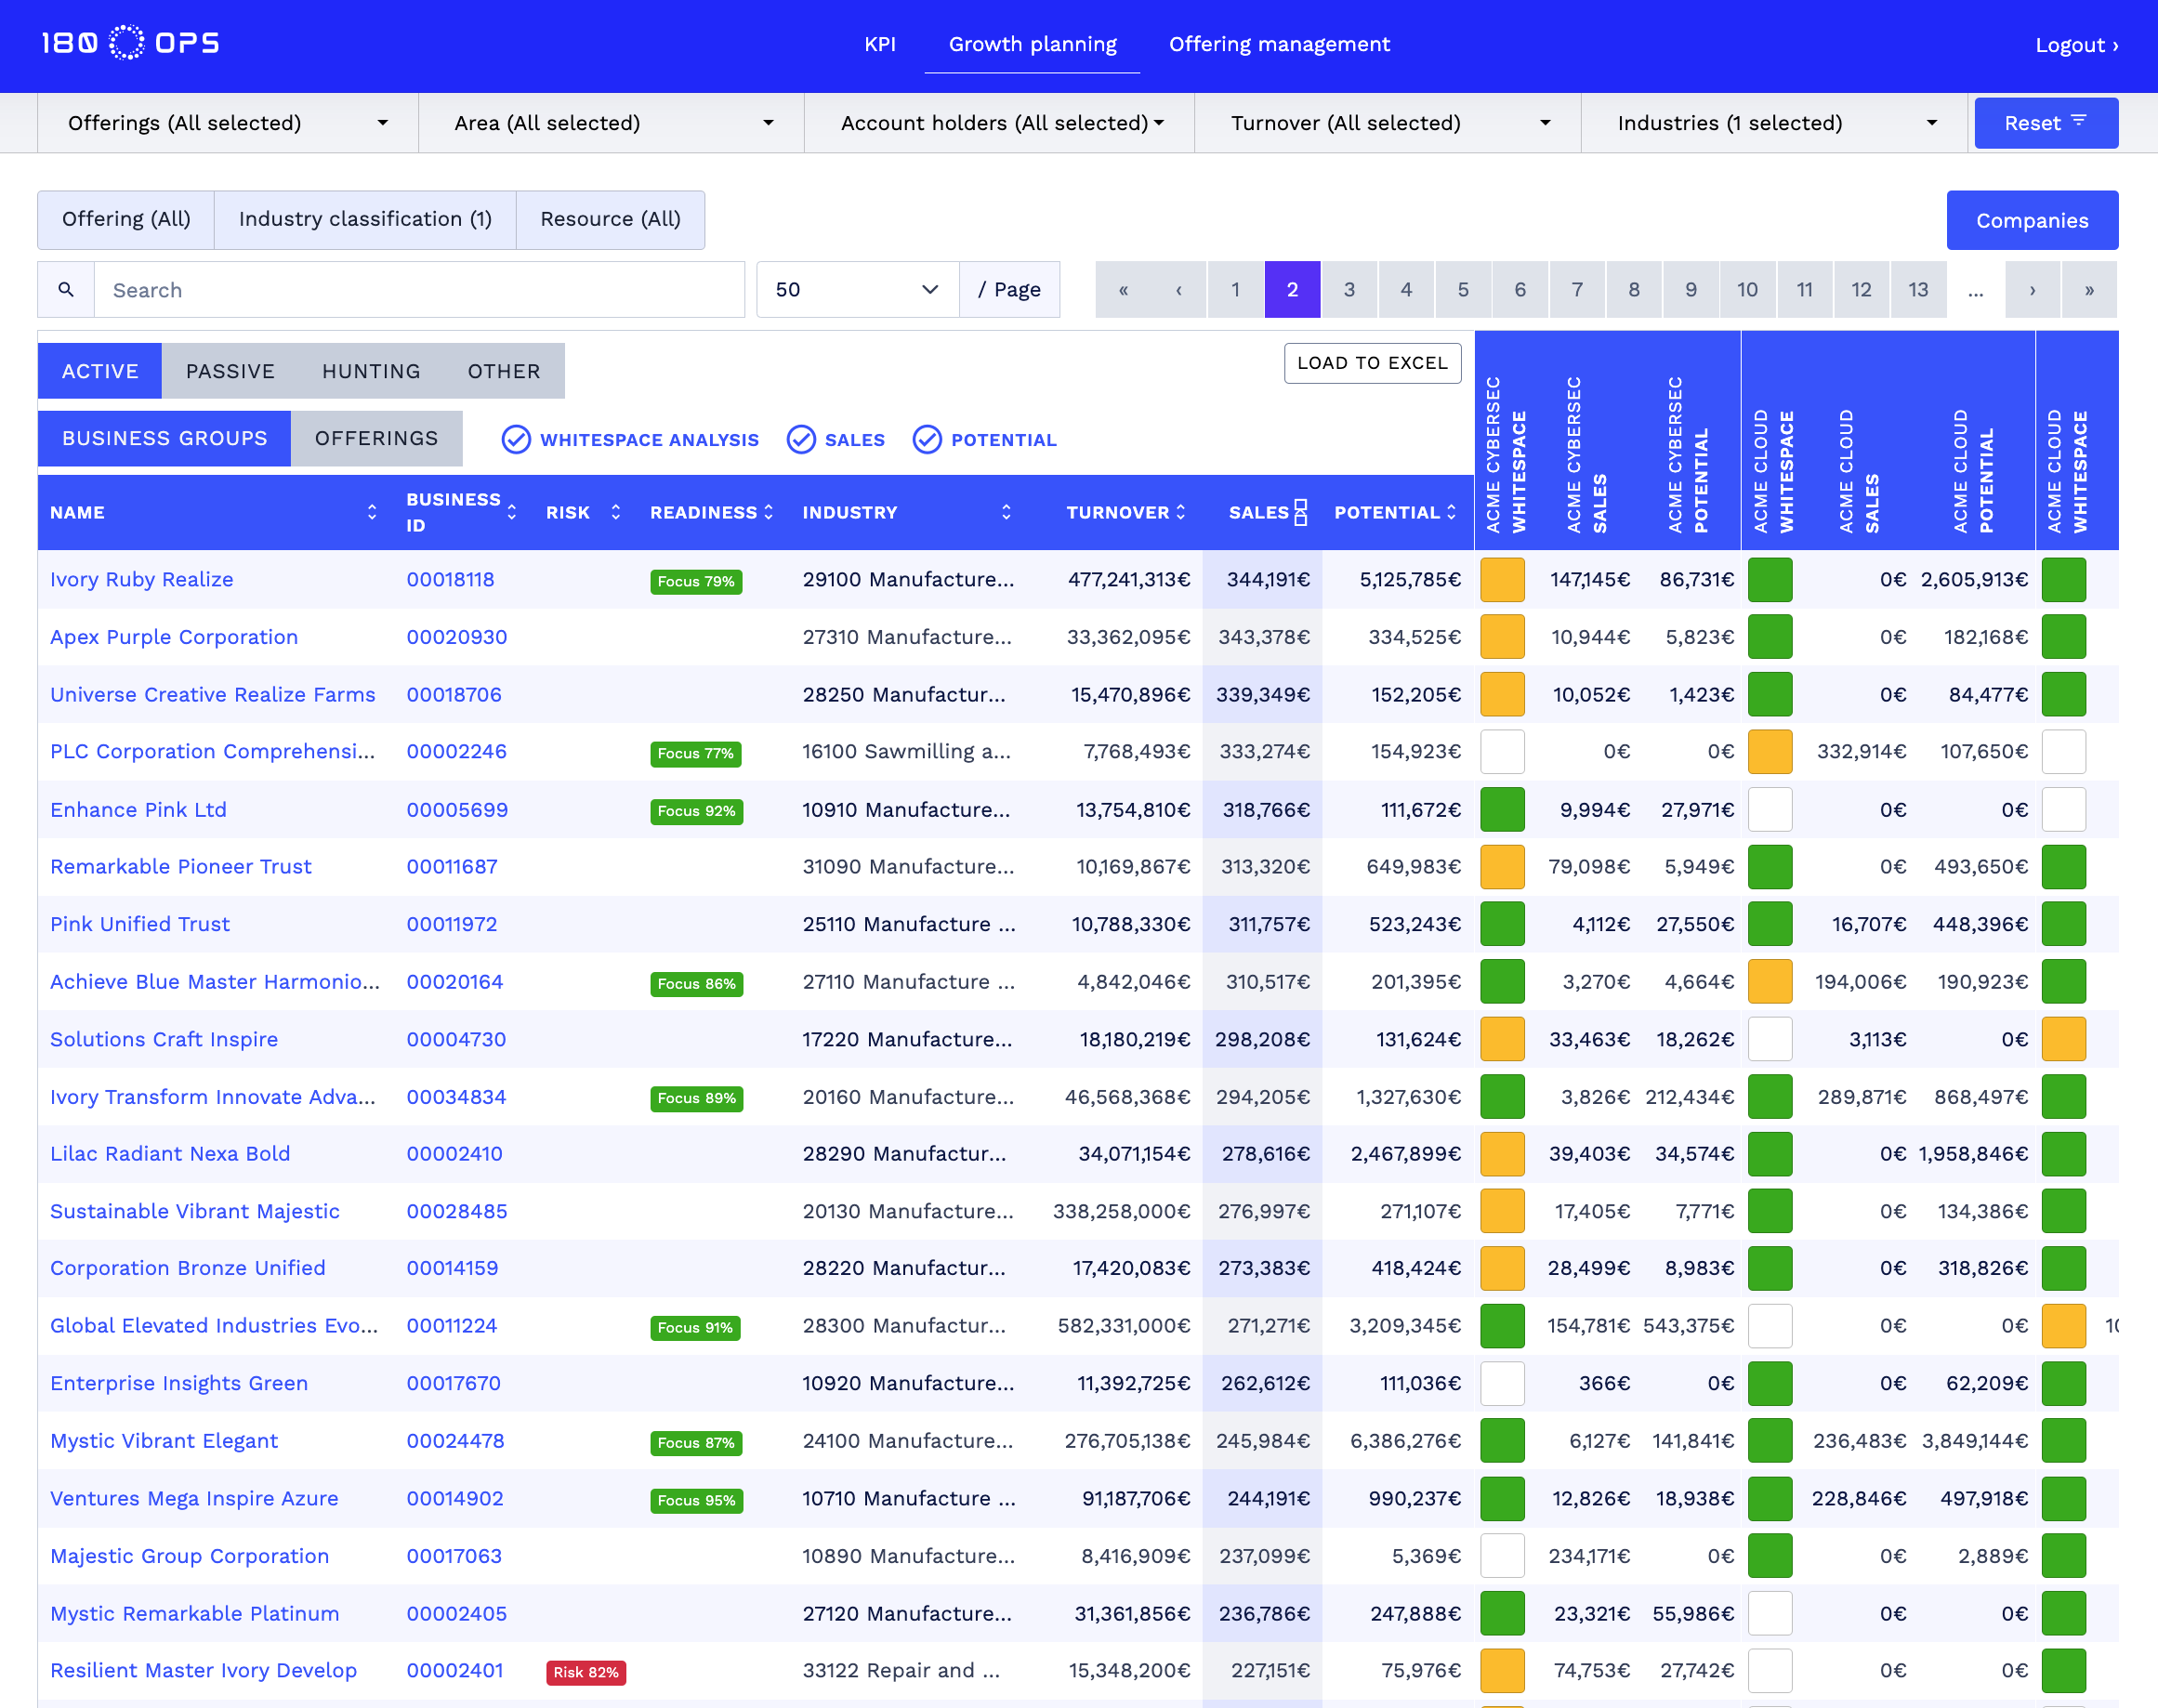
Now, this listing is based on the selection criteria you have used and gives a quick view to how different companies represent risk of defect, buying readiness, sales (Current level of billing), up-sales potential and “colored white space analysis”. White means, that there is no potential for up-sales, yellow means there is up-sales potential, but it is lower than current billing and green means that there is more to win than is so far captured. You can view this list at business group or offering levels and narrow your perspective with filters.
Once you know what you want to do, you can download the selected segment to excel and plan a campaign or other activities for them.
Paradigm shifting feature is about Risk and Readiness, because now data is starting to work for the sales people and turns CRM proactive. These flags of risk and readiness are turned to “Tasks” for sales in CRM and they give direct advice: In this company, there is a heightened readiness to buy offering X, which has potential worth XXXXXX€). This same logic apply to Risk of defect.
This view allows you to list and analyze active, passive and hunting targets. Other stands for companies that have not been able to find evidence based potential for. They represent a market, that the company has not been able to serve sofar. This allows you to analyze companies that are out of your current scope of value generation with existing offerings. If your goal is to expand your reach in certain industries, this is where you can see who the customers are.
By clicking a single company, you get to dive to the fundamental level of individual businessID:
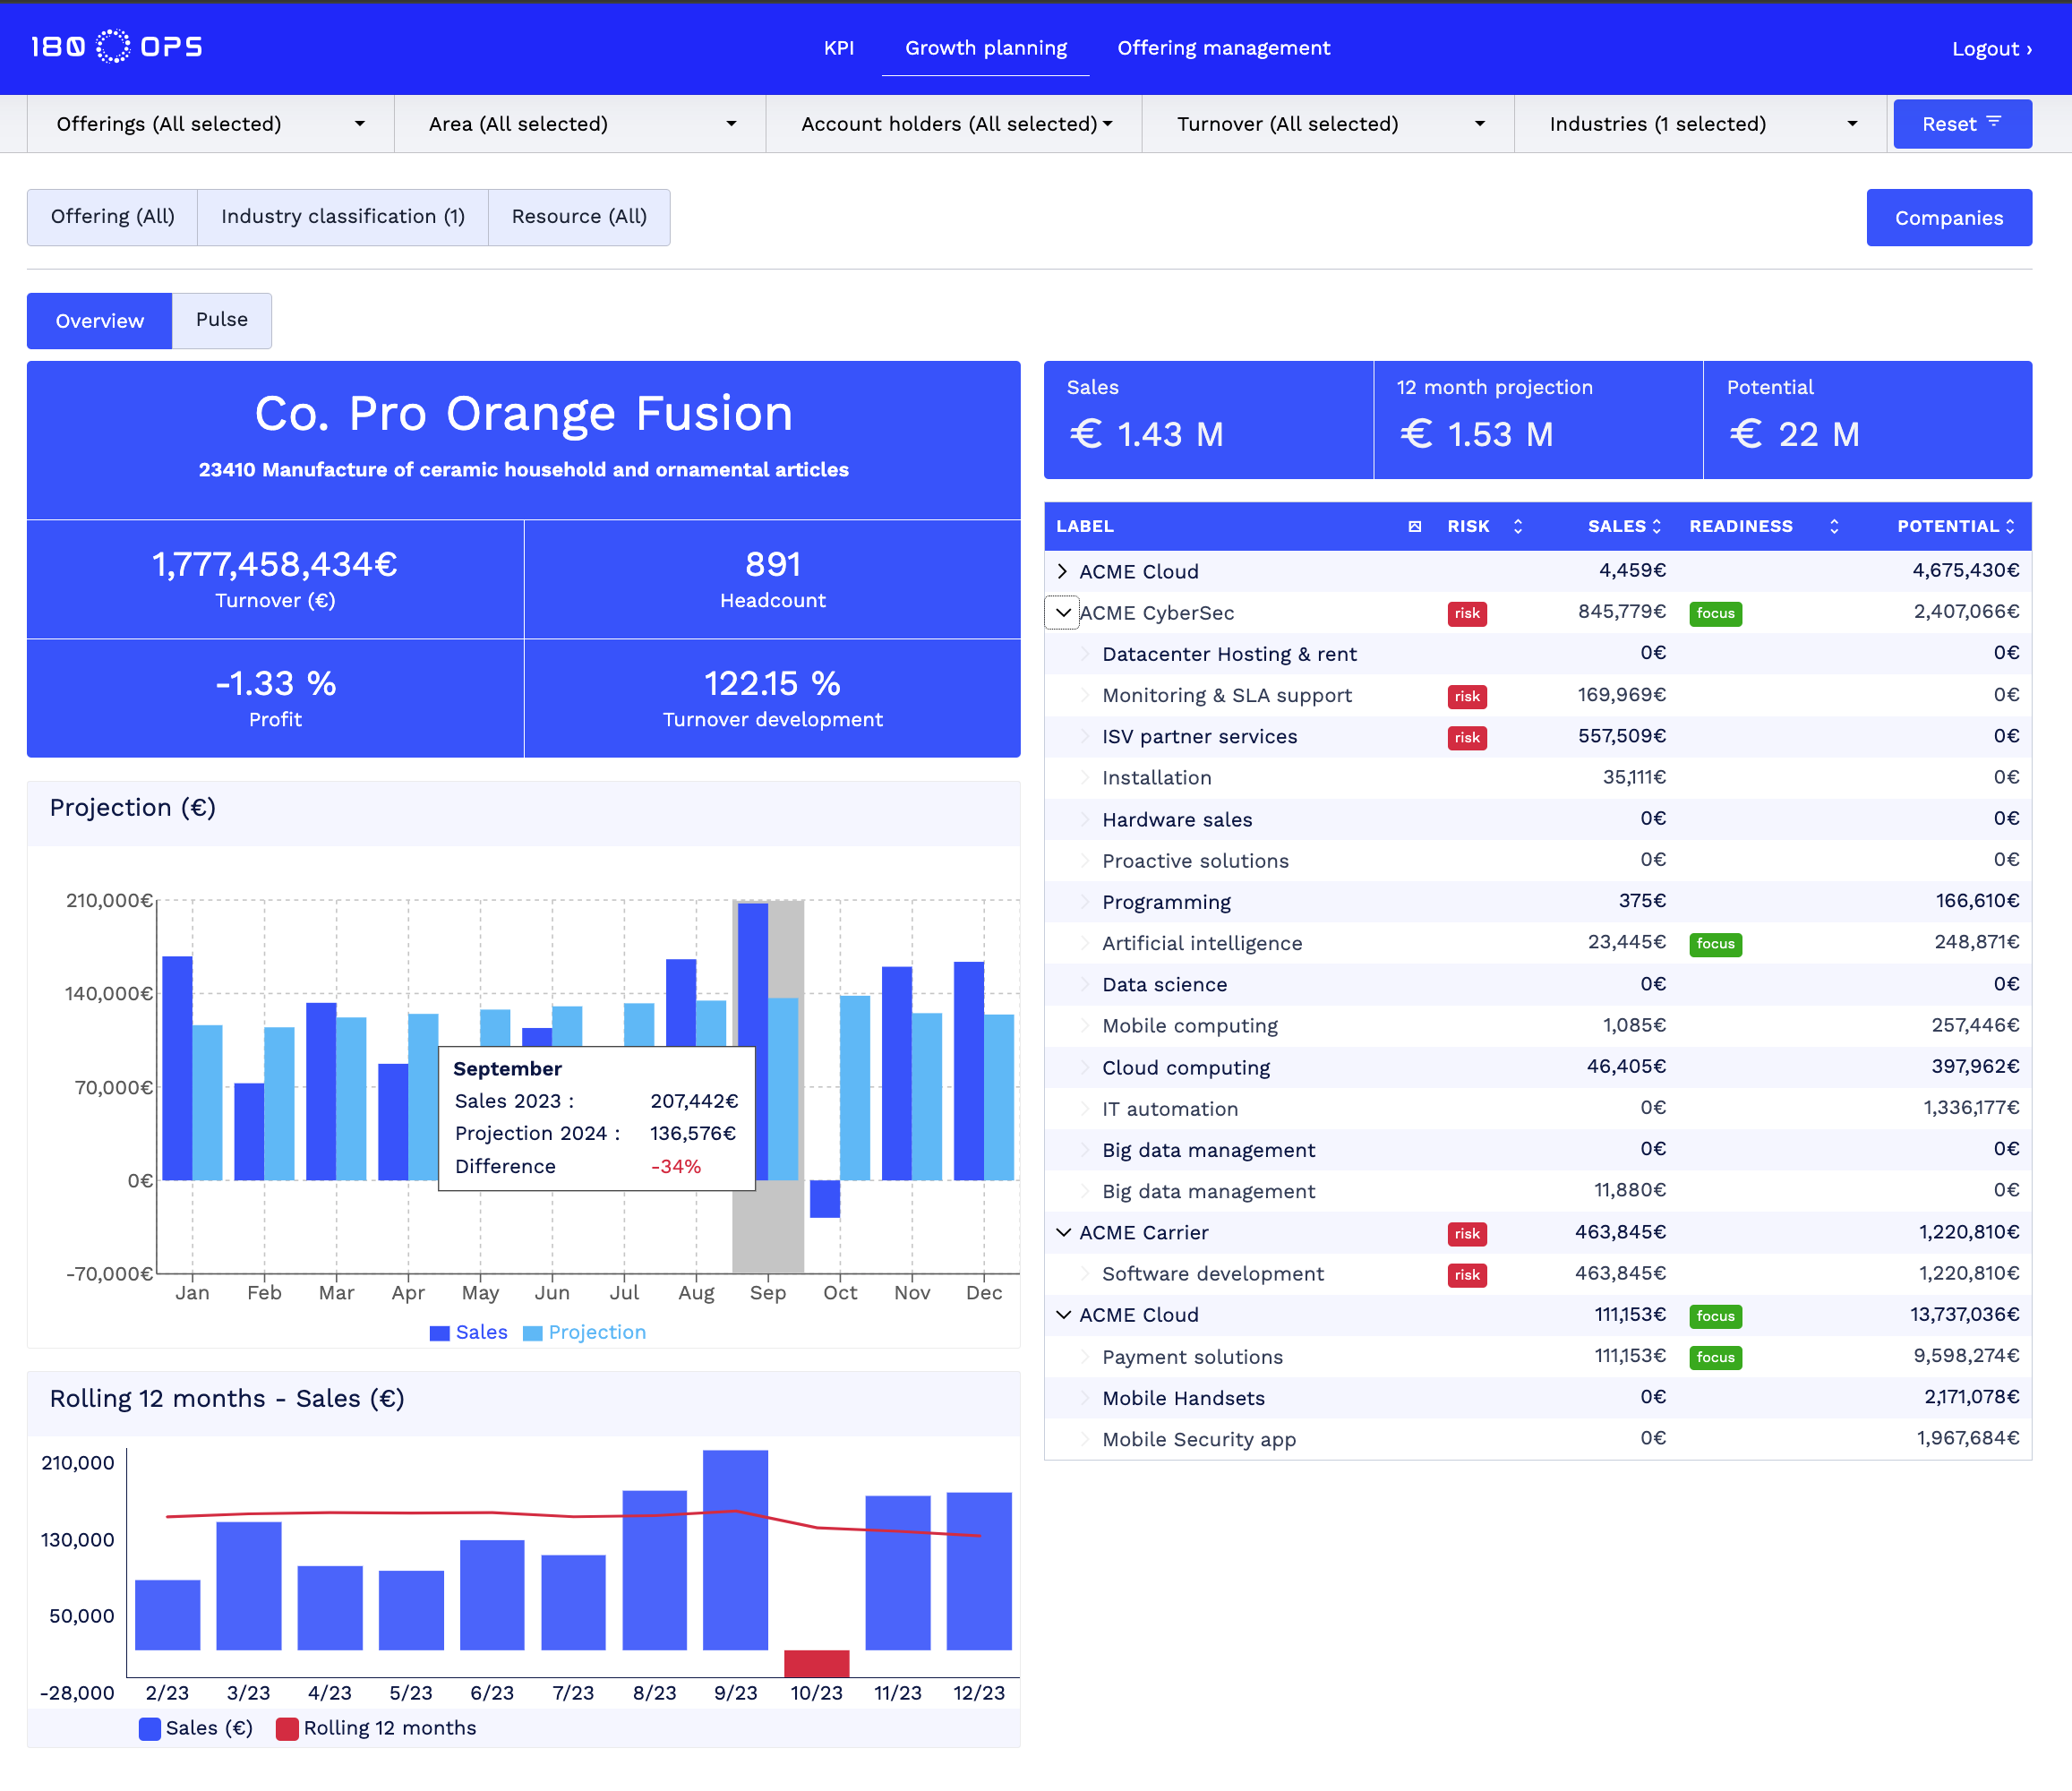
We distribute these customer level views to the company’s CRM, so that salespeople don’t need to go to other services for account planning purposes. This view answers multiple questions in very simple format:
- Historical billing by month and 12 month rolling trend of billing
- Billing Projection for the next 12 months. Is the customer going to grow or decline in the next 12 months
- Offering level intel about billing, upsales potential, risk of defect and readiness to buy
For account planning this view gives a longer term view to account development: In which offerings is the potential to grow? In short term, risks and readiness tell the salesperson what are the acute subjects to talk about with customers. How do you mitigate risks and how you take advantage of readiness and expanding the customer relationship to new offerings? The goal of this analysis approach is to maximize customer’s lifetimevalue and retention.
OFFERING ANALYSIS
Offering analysis has the same functions as customer listing and customer specific views, but from the point of view of offering.
Business management, CFOs and Controllers absolutely love those views, because we can provide them with constantly up-to-date intel about offerings, their billing, forecasts, risks and new customer acquisition success with readiness.
OKR AND OTHER AGILE MANAGEMENT NEEDS
We are constantly exposed to VUCA economy (Volatile, Uncertain, Complex, Ambiguous) in business management has a strong need to adapt to changing situation.
Richard Rumelt wrote in his book “The Crux: How Leaders Become Strategists” that you need to constantly recognize “Addressable and solvable challenges”. In his book he is mostly concentrating on new innovations that are capable of breaking the status quo, but that is also true with existing offerings. Majority of companies have not recognised the full potential of their existing assets and offerings.
However, evidence based analytics has the power to deliver clarity and priority to changing market conditions. This means that the management is capable of becoming proactive rather than reactive, seize the opportunities more effectively and maximize the productivity and growth that is available with the existing offerings. This is something that benefits all C-level decision makers:
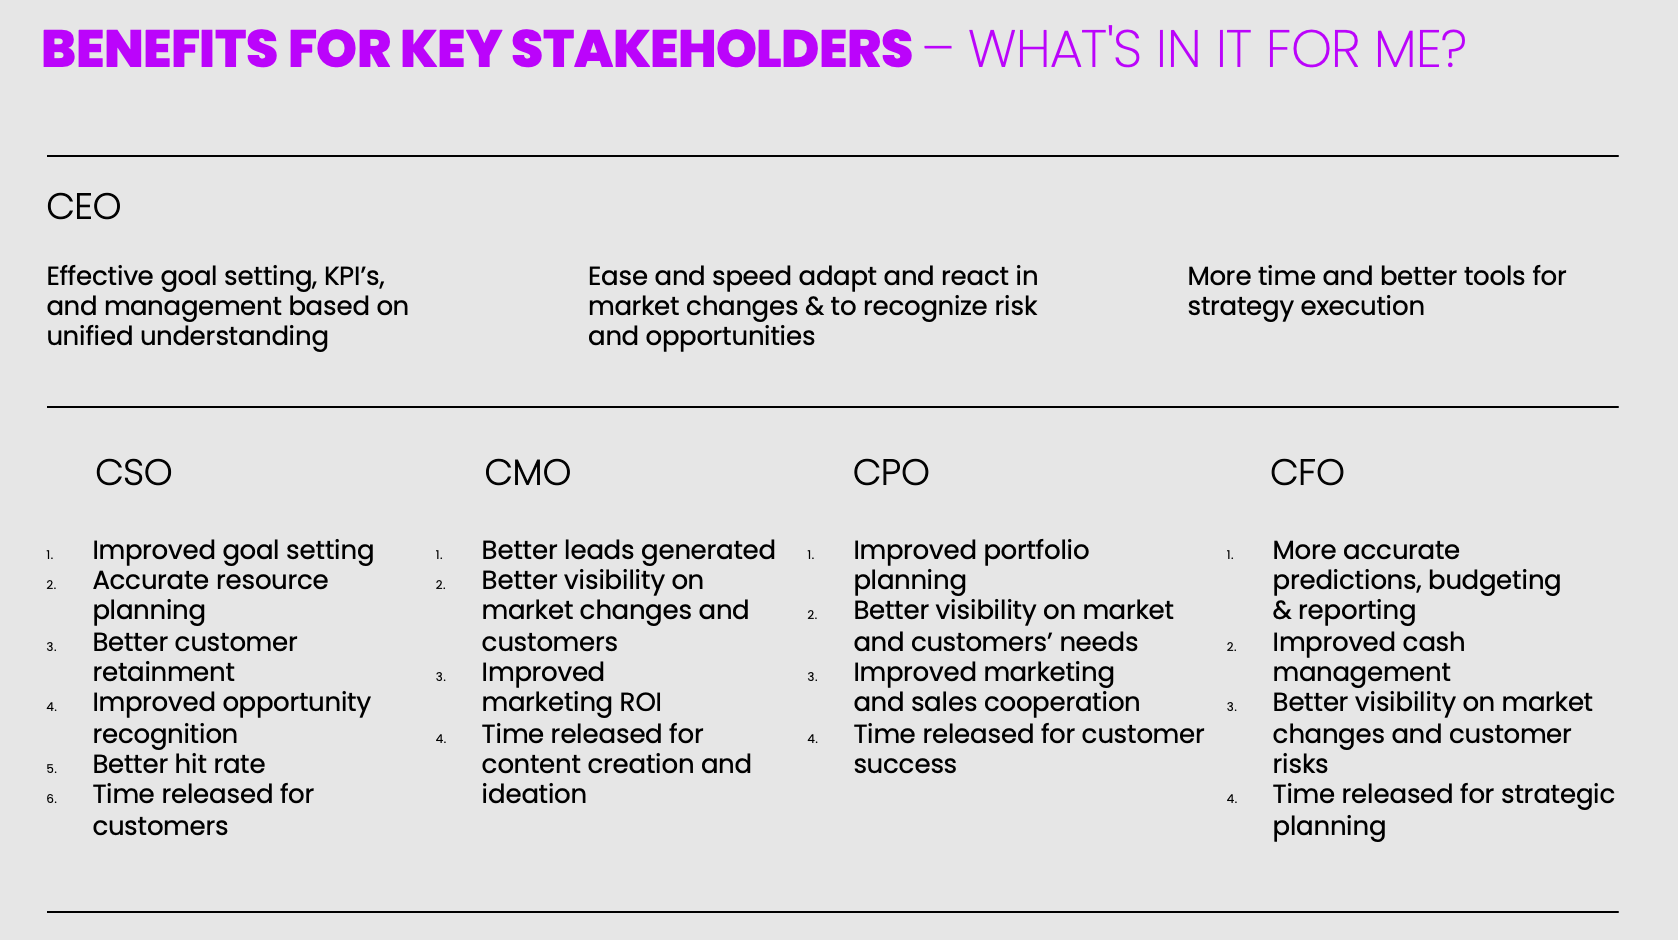
Having shared view to reality across functions also enable shared goals and stronger collaboration across organisational silos and operations.
This is something that benefits everyone from the BoD to management team to customer facing operations. It has been our goal to create an outside-in, bottom-up management technology and empower people to take control of their domain. We believe that this is an approach that connects very well with e.g. OKR set-up definitions and creates a bridge between strategy and operations at both planning and measurement levels.
If you share our perspective and mission, please contact me and let’s start your Path to Growth and Profitability!
Book a meeting with Toni Keskinen HERE